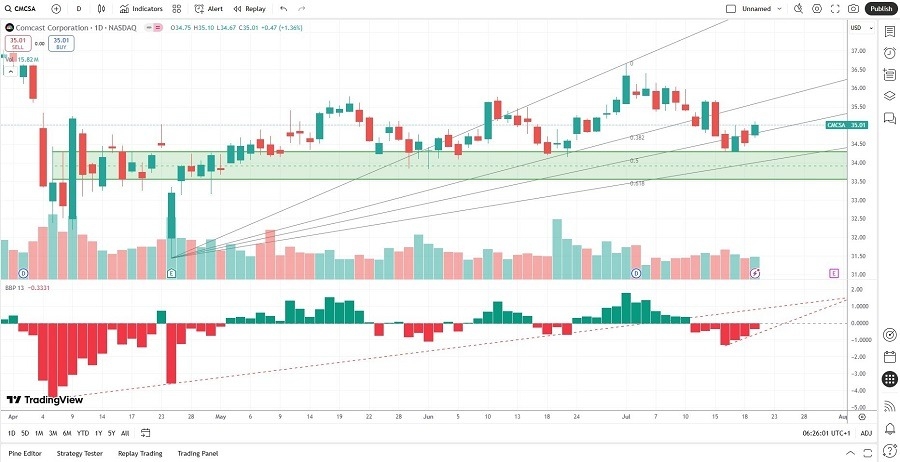
Long Trade Idea
Enter your long position between 34.28 (the upper band of its horizontal support zone) and 35.10 (yesterday’s intra-day high).
Market Index Analysis
- Comcast (CMCSA) is a member of the NASDAQ 100, S&P 100, and the S&P 500.
- All three indices remain near record highs, but bearish trading volumes are rising.
- The Bull Bear Power Indicator of the S&P 500 shows a negative divergence.
Market Sentiment Analysis
Equity markets pushed higher yesterday and recorded fresh intra-day records, but the underlying factors suggest bullish exhaustion. The S&P 500 has not moved more than 1% intraday for several weeks, and the NASDAQ 100 displays momentum not seen since 1999, before the Dot Com Crash. The EU prepares for a tariff no-deal with the US, and big tech earnings face a big test to confirm the recent rally. Overall, the obstacles to a continuation of the rally increase.
Comcast Fundamental Analysis
Comcast is a media and entertainment conglomerate. It is also the world’s fourth largest media company measured by revenue. In the US, it is the third-largest pay TV company, the second-largest cable TV company, and the largest internet service provider.
So, why am I bullish on CMCSA despite its recent struggles?
Investors focus on the changing entertainment trends, driven by fading demand for cable TV, which has punished Comcast’s share price, while boosting its dividend yield. The Universal division should continue to support share prices near current levels. Xfinity continues its expansion, and the recently opened theme parks under the theme park division should boost revenues enough to become a positive driver.

The price-to-earning (P/E) ratio of 15.80 makes CMCSA a cheap and undervalued stock. By comparison, the P/E ratio for the S&P 500 is 29.06.
The average analyst price target for CMCSA is 39.99. It suggests decent upside potential from current levels.
Comcast Technical Analysis
Today’s CMCSA Signal

Comcast Price Chart
- The CMCSA D1 chart shows price action bouncing off a horizontal support zone.
- It also shows support from the ascending 50.0% Fibonacci Retracement Fan level.
- The Bull Bear Power Indicator is bearish but should move higher inside an ascending triangle.
- The trading volume on the bounce higher eclipsed average selling volumes.
- CMCSA corrected as the S&P 500 rallied to fresh highs, a significant bearish development, but volumes remain bullish.
My Call
I am taking a long position in CMCSA between 34.28 and 35.10. Support levels are holding up nicely, and CMCSA shows a healthy balance sheet, besides the current ratio. It is well-positioned to adapt its business model to the changing entertainment landscape, while the dividend yield provides an additional bonus.
- CMCSA Entry Level: Between 34.28 and 35.10
- CMCSA Take Profit: Between 43.30 and 45.31
- CMCSA Stop Loss: Between 31.44 and 32.20
- Risk/Reward Ratio: 3.18
Ready to trade our daily signals? Here is our list of the best brokers for trading worth checking out.
