
Bullish view
- Buy the BTC/USD pair and set a take-profit at 112,000.
- Add a stop-loss at 104,000.
- Timeline: 1-2 days.
Bearish view
- Sell the BTC/USD pair and set a take-profit at 104,000.
- Add a stop-loss at 112,000.
Bitcoin price remained in a tight range on Wednesday, even after as spot ETFs crossed the important $50 billion inflow milestone. The BTC/USD pair was trading at 108,780, down from the year-to-date high of 111,900. It remains about 45% above the lowest level in April.
Top Regulated Brokers
Data shows that spot Bitcoin ETFs had inflows in the last four consecutive days, bringing the cumulative inflows to $50 billion. Seven Bitcoin ETFs have over $1 billion in assets, with the BlackRock fund having over $75 billion.
Fidelity’s FBTC ETF has over $22 billion, while the Grayscale GBTC and Cathie Wood’s ARKB have $20 billion and $5.2 billion.
Bitcoin also wavered as the US Dollar Index (DXY) rose slightly. The dollar rose to $97.5, up from this month’s low of $96. It also wavered as US indices, such as the Dow Jones and the S&P 500, continued to fall.
The BTC/USD pair has also moved sideways, as concerns about the economy persisted following Donald Trump's announcement of numerous tariff measures. He will implement tariffs on copper, which pushed its prices up by over 17%. Similarly, he announced a series of tariffs on top countries like South Africa and Indonesia.
Bitcoin price will react mildly to the upcoming Federal Reserve minutes. These minutes will provide more information about the last meeting and possibly hint on what to expect in the next one.
BTC/USD Technical Analysis
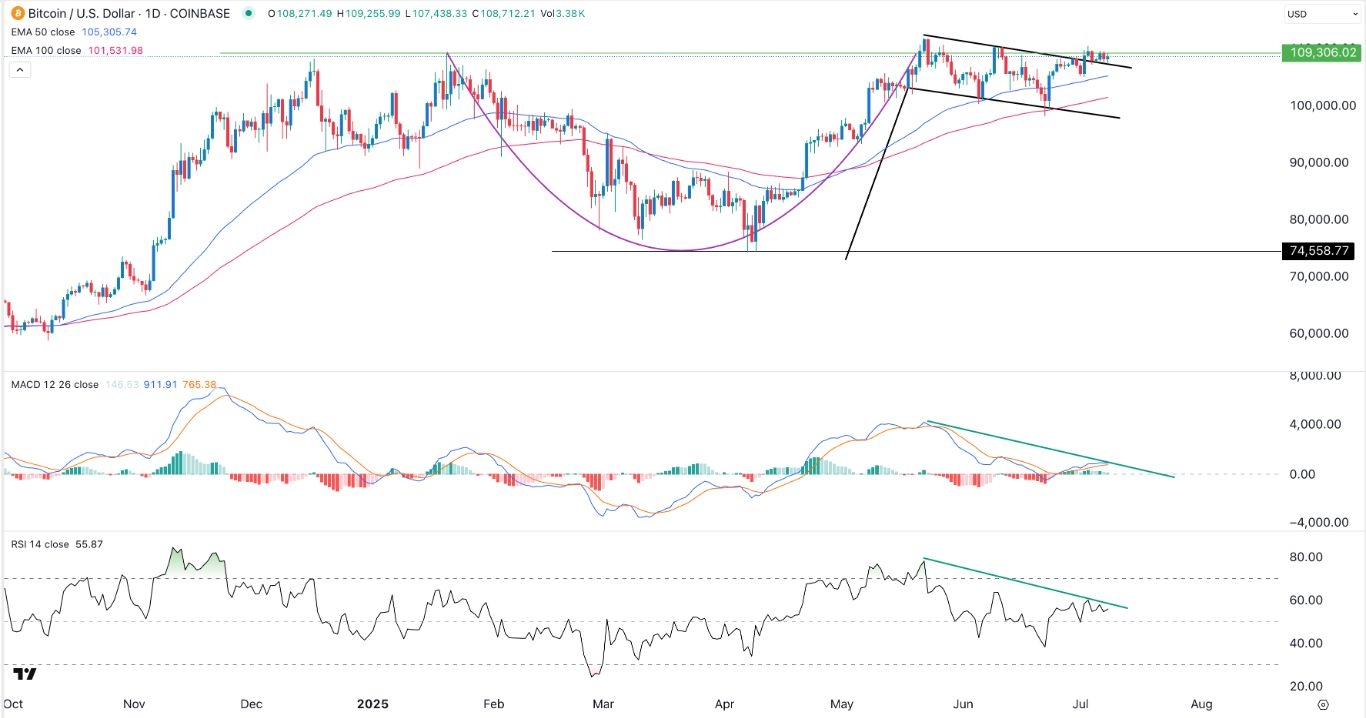
The daily chart shows that the BTC/USD pair has been in a strong bull run in the past few months. It moved from a low of 74,558 in April to the current 108,800.
Bitcoin price has moved above the 50-day and 100-day Exponential Moving Averages (EMA). Moving above these averages is a sign that bulls are in control.
The BTC/USD pair has formed a bullish flag pattern, comprising a descending channel and a vertical line. A flag is a highly bullish chart pattern. Also, the pair has formed a cup-and-handle pattern.
Therefore, the pair will likely continue rising as bulls target the key resistance level at 112,000. A move above that level will point to more gains, potentially to 115,000. A drop below the support at 105,000 will invalidate the bullsh view.
Ready to trade Bitcoin to the dollar? We’ve made a list of the best Forex crypto brokers worth trading with.