
Bullish view
- Buy the BTC/USD pair and set a take-profit at 112,000.
- Add a stop-loss at 105,000.
- Timeline: 1-2 days.
Bearish view
- Sell the BTC/USD pair and set a take-profit at 104,000.
- Add a stop-loss at 112,000.
Bitcoin price was stuck in a range, continuing a trend that has been going on in the past few days. The BTC/USD pair was trading at 108,170 on Tuesday, a few points below this month’s high of 110,1000. It remains much higher than the year-to-date low of 74,558.
Top Regulated Brokers
Bitcoin’s consolidation has mirrored that of the altcoin market, with most tokens remaining in a tight range in the past few days. Ethereum price was trading at $2,500, while the market capitalization of all tokens remained at $3.4 trillion.
Bitcoin has remained in this range despite the ongoing accumulation by companies and investors. While MicroStrategy did not buy any Bitcoin last week, it remains the biggest holder with its positions nearing the 600,000 mark.
Other companies like MetaPlanet and Trump Media have continued their accumulation in the past few months. This a sign of increased demand at a time when the supply of Bitcoin in exchanges has dropped sharply in the past few months.
The BTC/USD pair wavered as the US Dollar Index (DXY) rose gradually this week. The index, which tracks the dollar’s performance against a basket of currencies, has risen to $97.5 from the year-to-date low of $96. It rose after Trump unveiled some trade deals and after last Thursday’s strong jobs numbers.
Data showed that the economy created over 147,000 jobs, while the unemployment rate improved to 4.6%. Falling jobless rate is a sign that the economy is doing well, which will push the Federal Reserve to maintain interest rates steady in the coming meeting.
BTC/USD Technical Analysis
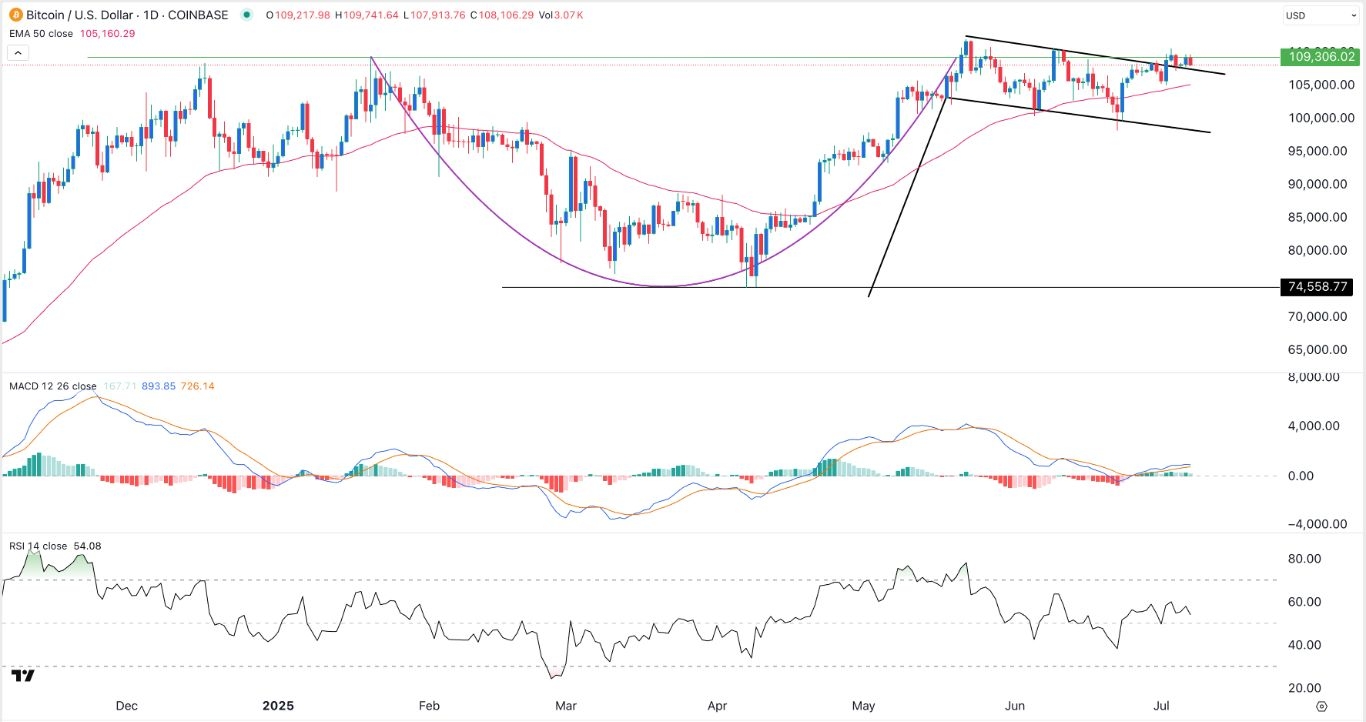
The daily chart shows that the BTC/USD pair has remained in a consolidation phase in the past few days. It remans slightly below the year-to-date high of 111,900, and above the 50-day moving average.
Bitcoin has formed a cup-and-handle pattern, a highly popular continuation sign in technical analysis. It has also formed a bullish flag pattern, comprising of a vertical line and a descending channel.
The Relative Strength Index (RSI) has moved above the neutral point at 50, while the MACD has jumped above the zero line. Therefore, the pair will likely have a bullish breakout, with the next point to watch being at 112,000. A beak below the support at 105,160 will invalidate the bullish view.
Ready to trade our free Forex signals? Here are the best MT4 crypto brokers to choose from.