Bullish view
- Buy the BTC/USD pair and set a take-profit at 112,000.
- Add a stop-loss at 104,000.
- Timeline: 1-2 days.
Bearish view
- Sell the BTC/USD pair and set a take-profit at 104,000.
- Add a stop-loss at 112,000.

Bitcoin price remained steady on Monday, with technicals pointing to an eventual reboun to a record high soon. The BTC/USD pair was trading at 109,000, a few points below all-time high of 111,900. It has jumped by over 11.25% from its lowest level in June.
Fundamentals point to more Bitcoin gains in the coming weeks. For one, data shows that Bitcoin ETFs continued drawing investors as inflows continued rising this month.
These ETFs had over $769 million in inflows last week, the fourth consecutive weeks of gains. They have added nearly $6 billion in assets in the past four weeks, a sign that American investors expect the price to keep rising.
More data shows that the ongoing Bitcoin ETF inflows surge is happening at a time when exchange outflows have jumped in the past few months. Exchanges hold about 1.2 million coins, down from the year-t0-date high of 1.5 million.
The BTC/USD pair has also jumped as the US dollar index crashes amid concerns about the US debt situation. The dollar index, which tracks the greenback against other currencies, has plunged to $96, down from the year-to-date high of $110.
Concerns about the US economy have remained at an elevated level in the past few months. These concerns escalated last week after Donald Trump voted to approve the Republican Big Beautiful Bill that will increase the national debt substantially.
The next key catalysts for the BTC/USD pair will be the upcoming Federal Reserve minutes on Wednesday. These minutes will provide more color about the state of the economy and what to expect in the coming meetings.
BTC/USD technical analysis
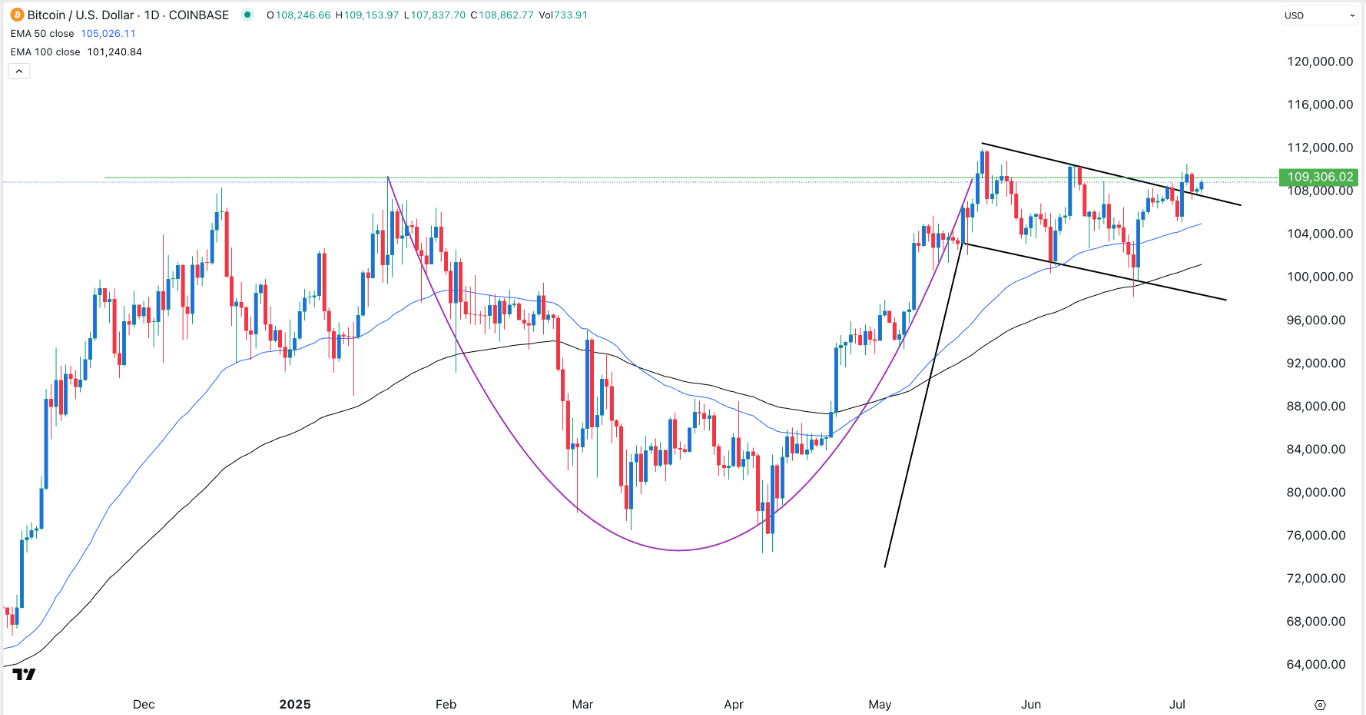
The daily chart shows that the BTC/USD pair has remained in a tight range in the past few days. It was trading at 109,000 on Monday, just a few percentage points below the all-time high.
Bitcoin has remained above the 50-day an 100-day Exponential Moving Averages (EMA), a sign that bulls are in control. It has forme a bullish flag pattern, comprising of a vertical line and a descending channel.
The BTC/USD pair has also formed the bullish cup-and-handle pattern, a popular bullish continuation sign. Therefore, the uptrend will likely continue in the coming months as bulls target the all-time high of nearly 112,000. A break above that level will point to more gains, potentially to 115,000.
Ready to trade our free Forex signals? Here are the best MT4 crypto brokers to choose from.
