Market Index Analysis
- Advanced Micro Devices (AMD) is a member of the NASDAQ 100, the S&P 100, and the S&P 500.
- All three indices are at or near record highs but underlying technical factors and emerging chart patterns hint at a potential short-term reversal.
- The Bull Bear Power Indicator of the NASDAQ 100 shows a negative divergence, and half of a reversal chart pattern has formed.
Market Sentiment Analysis
Today concludes the holiday-shortened trading week, and traders eagerly await the June NFP report, especially after yesterday’s ADP report showed an unexpected job loss of 33K. It counters some trade optimism after the US rescinded export restrictions on chip design software to China amid ongoing trade talks. China lifted export restrictions on select rare earth exports to the US. President Trump’s Megabill remains stuck in the House of Representatives for now, as Republicans lack the votes to pass it. Volatility could dominate today’s trading session.
Advanced Micro Devices Fundamental Analysis
Advanced Micro Devices is an industry-leading chip manufacturer at the forefront of the global AI race. It is also a core player in the gaming sector, where its hardware is among the best for high-end users, and a significant provider of server hardware to data centers.
So, why am I bearish on AMD despite its recent massive rally?
I believe the short-term fundamentals for AMD warrant a breather, which is likely to follow a general pause in the AI-led tech rally. I like AMD in the long term and buy the dip during any significant sell-off. Still, its valuations do not support the current price. Intense competition from China will continue to take markets away from AMD and NVIDIA and share prices have not fully priced in pending headwinds.

The price-to-earnings (PE) ratio of 101.11 makes AMD an extremely expensive stock. By comparison, the PE ratio for the NASDAQ 100 is 40.11.
The average analyst price target for AMD is 131.95, which suggests no upside potential. I think AMD is due a healthy correction within a long-term bullish trend.
Advanced Micro Devices Technical Analysis
Today’s AMD Signal

AMD Price Chart
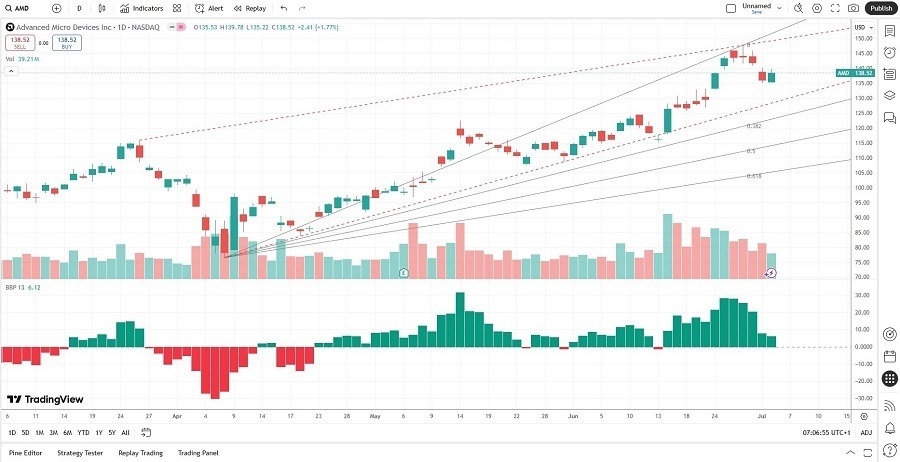
- The AMD D1 chart shows the Fibonacci Retracement Fan rejecting price action.
- It also shows a rising wedge formation, a bearish chart pattern.
- A head-and-shoulders pattern is half-formed, which is a reversal pattern.
- The Bull Bear Power Indicator is bullish but has contracted for five sessions.
- Trading volumes over the past week were higher during risk-off sessions.
Short Trade Idea
Enter your short position between 135.12 (the low of its latest bearish candle) and 140.23 (the high of its latest bearish candle).
My Call
I am taking a short position in AMD between 135.12 and 140.23. While the AI hype is likely to add to gains, the share price has overshot most analyst expectations, the valuations are expensive, and I am wary of the next earnings release, which could disappoint lofty expectations.
- AMD Entry Level: Between 135.12 and 140.23
- AMD Take Profit: Between 96.88 and 110.67
- AMD Stop Loss: Between 147.75 and 158.94
- Risk/Reward Ratio: 3.03
Ready to trade our free signals? Here is our list of the best stock trading platforms worth checking out.
