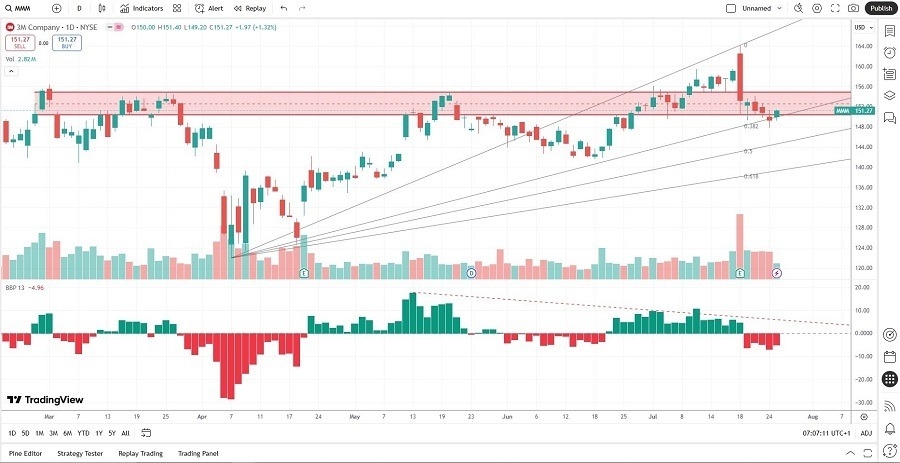
Short Trade Idea
Enter your short position between 147.81 (the intra-day low of its last bearish candle) and 154.73 (the upper band of its horizontal resistance zone).
Market Index Analysis
- 3M Company (MMM) is a member of the Dow Jones Industrial Average, the S&P 100, and the S&P 500.
- All three indices are at or near record highs, but volumes during selloffs are higher than during rallies.
- The Bull Bear Power Indicator of the S&P 500 shows a negative divergence.
Market Sentiment Analysis
The US and the EU reached a trade deal with a baseline tariff rate of 15%, while investors await developments on the US-China trade front. This week kicks off the busiest week for second quarter earnings, and markets could experience increased volatility until the release of July’s US NFP report on Friday. While US President Trump forces countries into tariff deals, the inflationary outlook remains uncertain, and economic risks boil under the surface.
3M Company Fundamental Analysis
3M Company is an industrial conglomerate that supplies over 60,000 products to industrial clients, the transportation sector, electronics, worker safety, and consumer goods. It has over 100,000 patents.
So, why am I bearish on MMM after its earnings release?
The 3M Company must deal with higher input costs, as trade deals have tariff rates exceeding the 10% level. While the impact remains uncertain, MMM must accept lower revenues or increase costs, which could stretch consumers. The negative earnings growth could accelerate and add fuel to the sell-off, and valuations are sky-high.

The price-to-earnings (P/E) ratio of 21.01 makes MMM an expensive stock for its industry, but reasonable versus the S&P 500. By comparison, the P/E ratio for the S&P 500 is 29.48.
The average analyst price target for MMM is 161.15. It suggests moderate upside from current levels.
3M Company Technical Analysis
Today’s MMM Signal

- The MMM D1 chart shows price action inside its horizontal resistance zone.
- It also shows price action challenging the ascending 38.2% Fibonacci Retracement Fan level.
- The Bull Bear Power Indicator is bearish with a descending trendline.
- Trading volumes are higher during selloffs than during rallies.
- MMM corrected as the S&P 500 rallied to fresh highs, a significant bearish development.
My Call
I am taking a short position in MMM between 147.81 and 154.73. The P/E, P/B, and PEG ratios flash warning signals, and investors should not ignore the negative earnings growth. Higher tariffs will hurt the bottom line, economic uncertainty remains, and I will sell the rallies in this industrial conglomerate.
- MMM Entry Level: Between 147.81 and 154.73
- MMM Take Profit: Between 121.98 and 130.36
- MMM Stop Loss: Between 159.47 and 164.15
- Risk/Reward Ratio: 2.22
Ready to trade our free daily signals? Here is our list of the best brokers for trading worth checking out.
