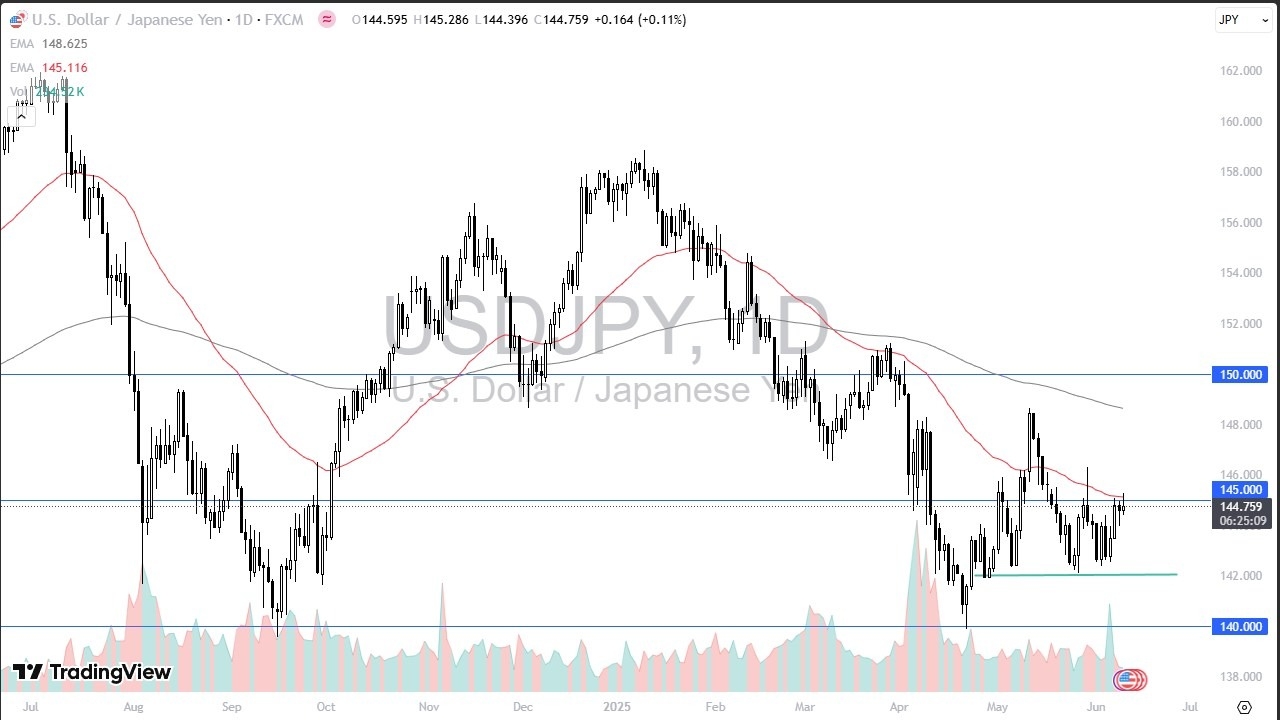
- The US dollar has rallied a bit during the trading session on Tuesday, but it does look like we are struggling to stay above the crucial ¥145 level.
- The ¥145 level is an area that has been important multiple times, and you have to look at this through the prism of a market that is trying to break through multiple reasons to stay lower.

Technical Analysis
The technical analysis for this pair obviously is somewhat sideways, and at this point in time the market is trying to break above the 50 Day EMA, and of course the aforementioned ¥145 level can get above there, then the market might go looking to the ¥146.50 level. That is the top of the shooting star from 2 weeks ago that marks a major resistance barrier.
Top Regulated Brokers
Anything above there opens up the possibility of the US dollar going to the 200 Day EMA. The 200 Day EMA is going to end up being an indicator that a lot of people will pay close attention to, because quite frankly it is so widely followed, and typically thought of as a determination of the longer-term trend.
If we do fall from here, there is plenty of support underneath, especially near the ¥142 level is. The ¥142 level has been reliable over the last several weeks, and I think at this point in time you have to look at that as the potential “floor in the market.” If we were to break down below there, then we could see the US dollar trade down to the ¥140 level, but I don’t necessarily expect to see that. After all, the previous candlestick was a bit of a hammer, so this shows a likelihood of more sideways action in the short term. That makes sense, considering that we have the CPI numbers coming out during the trading session on Wednesday, so there might be a little bit of hesitation to put a lot of money to work in this market.
Want to trade our USD/JPY forex analysis and predictions? Here's a list of forex brokers in Japan to check out.
