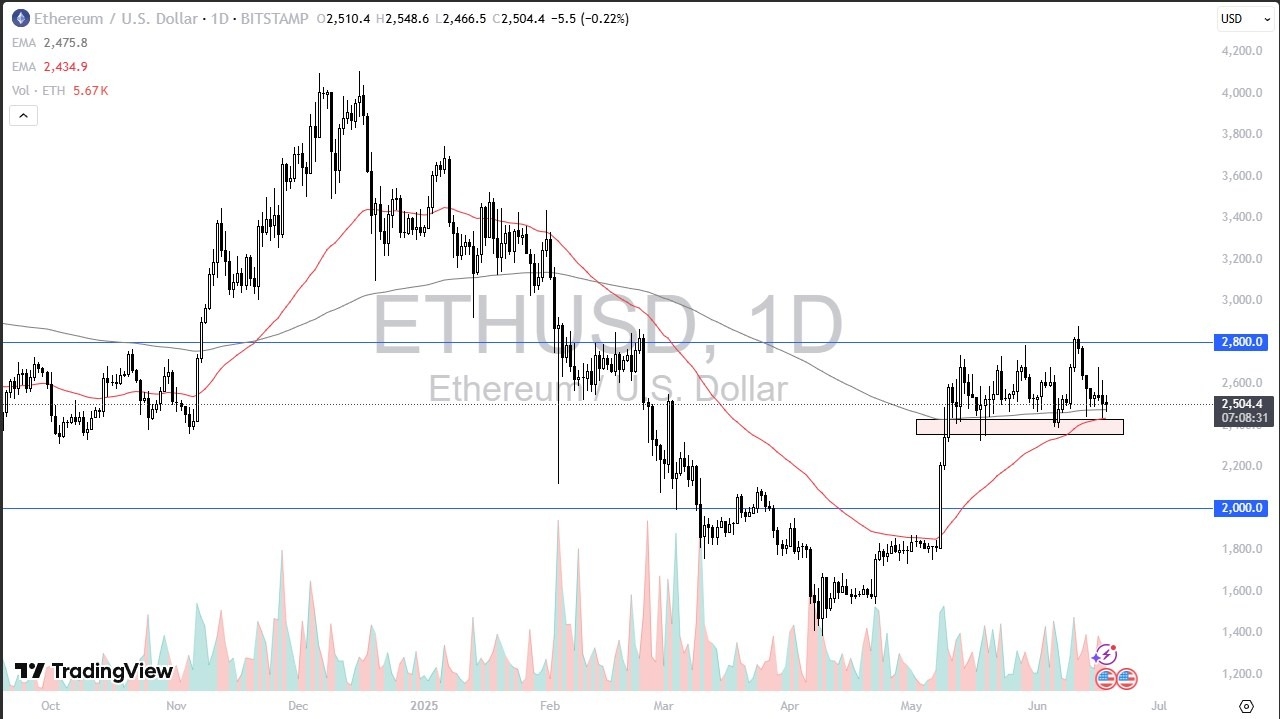
- The Ethereum market has gone back and forth during the course of the early hours here on Wednesday, as we are dancing around the crucial 200 day EMA.
- Keep in mind that the 200 day EMA obviously is a widely followed indicator and it is offering a bit of a trend line over the last couple of months.
- Ethereum is basically moving at the behest of Bitcoin traders. So, what we're seeing here is somewhat of a mirror image of recent Bitcoin trading.
- Instead of $110,000 resistance like you have in Bitcoin, in Ethereum you have $2,800. Anything above there could open up a move to the $3,300 level.
Technical Analysis
Top Regulated Brokers
The 200 day EMA as support right around the $2,500 level is backed up by the 50 day EMA, which of course is sitting just below it. Anything below that could open up fresh selling down to the $2,000 level. And I think that would represent a potential buying opportunity.

Bitcoin has been fairly quiet and of course Ethereum has followed suit, but that also makes sense considering just how much of a push higher we have seen. That being the case, a little bit of time sideways typically is what is needed to work off some of the excess before you go higher. This is an area in the $2,500 region that will probably attract buyers, but we'll have to wait and see how that plays out. We are also, for what it is worth, in a major supply zone going back to late February. So again, a move above the recent high of the shooting star on Wednesday the 11th, I think opens up a lot of short covering. We'll need some help from Bitcoin, but if Bitcoin really starts to take off, I suspect Ethereum will follow suit.
Ready to trade ETH/USD? Here’s a list of some of the best crypto brokers to check out.
