Bearish view
- Sell the BTC/USD pair and set a take-profit at 95,000.
- Add a stop-loss at 105,000.
- Timeline: 1-2 days.
Bullish view
- Buy the BTC/USD pair and set a take-profit at 105,000.
- Add a take-profit at 95,000.

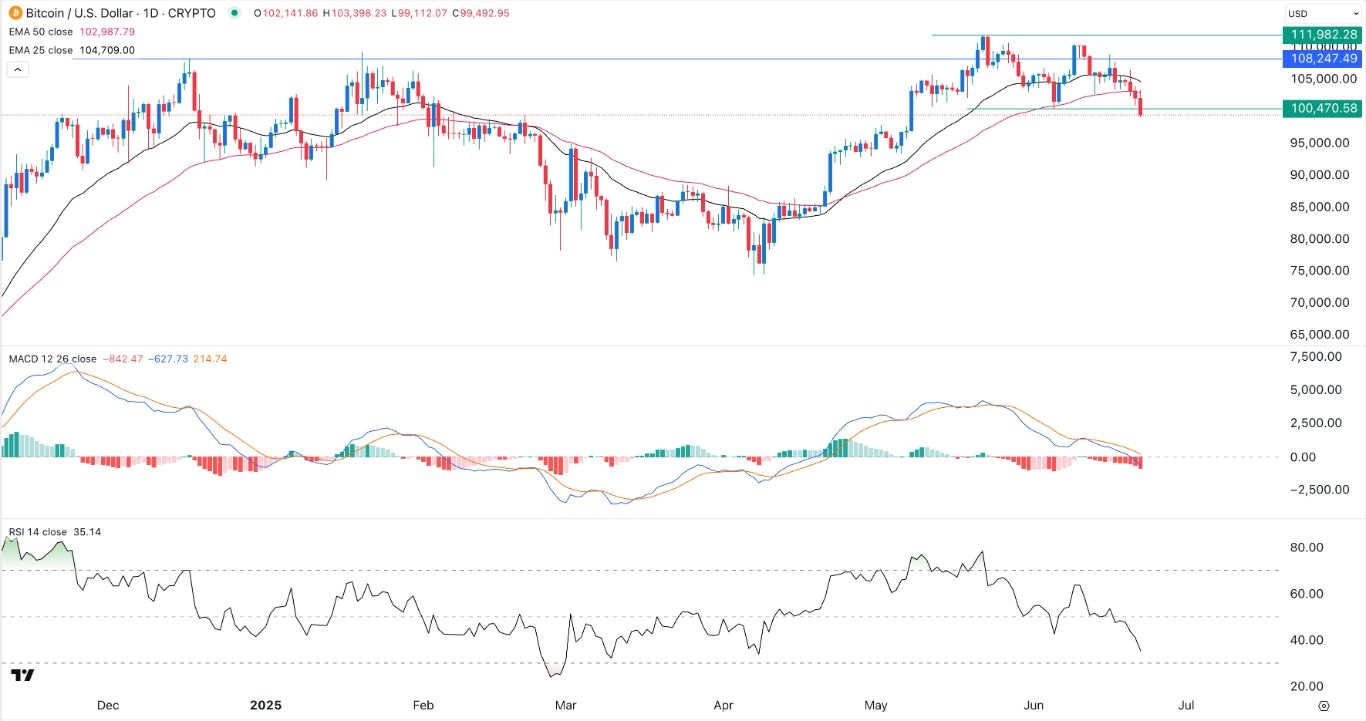
Bitcoin price crashed below the important support at $100,000 as investors dumped risky assets as geopolitical risks rose. The BTC/USD pair has plunged in the last four consecutive days, and is hovering near its lowest level since May 8. It entered a correction after falling by over 10% from the highest point this year.
Top Regulated Brokers
Bitcoin Price Crashes Amid Flight to Safety
Bitcoin and other risky assets plunged on Monday, continuing a trend that has been going on in the past few days. This crash happened after Donald Trump launched a big bomb attack in Iran that could lead to more geopolitical tensions.
He attacked three key nuclear facilities in Iran, a few weeks after Israel launched its attack on Israel. The hope is that this attack will prevent Iran from developing nuclear weapons that could put the US and Israel at risk.
Bitcoin and other risky assets plunged as investors anticipate an escalation in the coming months. At the same time, there are concerns that this crisis will make inflation stickier by pushing crude oil and shipping costs higher.
Economic data released by the Bureau of Labor Statistics showed that the headline consumer price index (CPI) rose from 2.3% in April to 2.4% in May, a trend that may continue as energy prices jump.
On the positive side, there are signs that demand from American investors is rising. Spot Bitcoin ETF inflows jumped by over $1 billion last week, down from $1.39 billion a week earlier. The decline is also likely because US markets were closed on Thursday for Juneteenth celebrations.
The other positive is that Bitcoin is slowly becoming a safe-haven asset, which often bounces back after a major geopolitical event.
BTC/USD Technical Analysis
The daily chart shows that the BTC/USD exchange rate has dropped from the all-time high of 111,980 in May to a low of 99,800. It moved below the key support at 100,000, the neckline of the double-top pattern. A double-top is one of the most popular bearish signs.
It has moved below the 50-day and 25-day moving averages, while the Relative Strength Index (RSI) have all pointed downwards. Therefore, the pair will likely continue falling as sellers target the next key support at 95,000. A move above the 25-day moving average at 104,700 will invalidate the bearish view.
Ready to trade our free Forex signals? Here are the best MT4 crypto brokers to choose from.
