Market Index Analysis
- Apple (AAPL) is a member of the NASDAQ 100 Index, the Dow Jones Industrial Average, the S&P 100 Index, and the S&P 500 Index.
- All four indices are at or near record highs, with technical analysis showing a potential price action reversal.
- Trading volumes during bullish sessions are lower than during bearish sessions.
- The Bull Bear Power Indicator of the NASDAQ 100 shows a negative divergence, which is a bearish sign suggesting a price action reversal could follow.
Market Sentiment Analysis
Equity markets are flirting with records despite ongoing bearish technical (to some extent) and fundamental indicators. Today’s session could push the NASDAQ 100 and the S&P 500 to fresh all-time highs after new records were set last week. Several analysts have noted the disconnect between price action and reality, but stocks can climb the wall of worry.
Apple Fundamental Analysis
Apple is the largest tech company by revenues and the third-largest company by market capitalization. It is at the core of the US tech industry, but it is taking a back seat to several disruptive trends. Still, it has high brand loyalty and a massive following.
So, why am I bearish on AAPL despite its sell-off?
While Apple has positive long-term prospects, it faces medium-term challenges. They include delays with updates to Siri, potential fines in the EU, and competition that is taking market share, especially outside the US. AAPL continues to generate long-term value, but it has lost its perceived safety status. It also failed to participate in recent rallies and drifted lower while the NASDAQ 100 advanced.

The price-to-earnings (PE) ratio of 25.19 makes AAPL an expensive stock. By comparison, the PE ratio for the Dow Jones Industrial Average is 31.00.
The average analyst price target for AAPL is 228.60, which coincides with a heavy horizontal resistance level. It suggests moderate upside potential, but analyst price targets have come down. I expect more downgrades.
Apple Technical Analysis
Today’s AAPL Signal

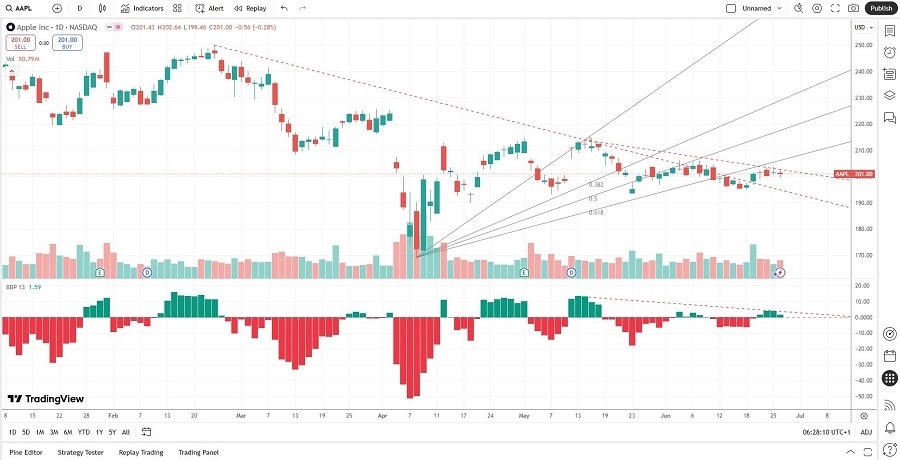
AAPL Price Chart
The AAPL D1 chart shows a breakdown below the Fibonacci Retracement Fan.
- It also shows downside pressure from a descending resistance level.
- The Bull Bear Power Indicator is contracting, and a bearish crossover is pending.
- A potential breakdown below its descending support level could magnify a selloff.
- AAPL failed to move higher with markets, a string bearish signal.
Short Trade Idea
Enter your short position between 197.43 (a core horizontal support/resistance area) and 206.24 (the peak of the previous high).
Top Regulated Brokers
My Call
I am taking a short position in AAPL between 197.43 and 206.24. I view the recent technical breakdown as a sign of more selling ahead. AAPL faces fundamental challenges from supply chain, regulatory fines, and delays in core bullish drivers, including updated phone models and AI. Therefore, I take a medium-term bearish position, especially considering the technical outlook for equity markets over the summer.
- AAPL Entry Level: Between 197.43 and 206.24
- AAPL Take Profit: Between 169.21 and 174.62
- AAPL Stop Loss: Between 208.42 and 216.23
- Risk/Reward Ratio: 2.57
Ready to trade our free signals? Here is our list of the best brokers for trading worth checking out.
