Today’s Gold Analysis Overview:
- Overall Trend for Gold: In a counter-bearish direction.
- Today's Gold Support Levels: $3145 – $3090 – $3000 per ounce.
- Today's Gold Resistance Levels: $3230 – $3280 – $3360 per ounce.

Today's gold trading signals update:
- Sell gold from the resistance level of $3290 with a target of $3100 and a stop-loss at $3360.
- Buy gold from the support level of $3070 with a target of $3300 and a stop-loss at $3000.
Technical Analysis of Gold Price (XAU/USD) Today:
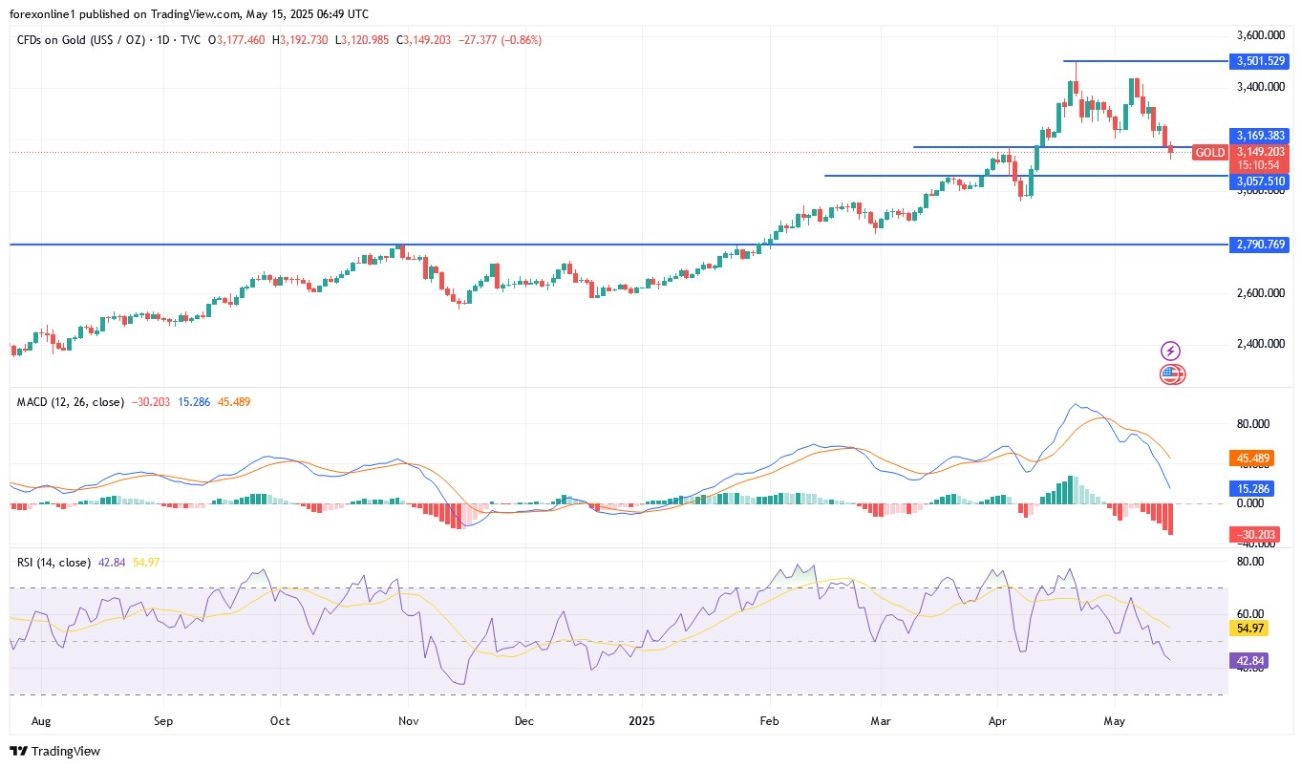
Amidst the continued strength of the US dollar and the abandonment of safe havens, selling pressure on gold persisted. Recent performance marked its fourth decline in the past six trading sessions, reaching its lowest closing in over a month. According to gold trading company platforms, the gold price index retreated to the $3168 per ounce support level, its lowest in a month, before stabilizing around the $3180 per ounce level at the start of trading today, Thursday. This sets the stage for a bearish weekly close. The strong decline in gold prices suggests that fund traders may have significantly reduced their investments in gold, and according to gold analysts' forecasts, the gold bullion market has room for further decline and may retest the $3,000 per ounce level for the first time since April 2025.
Top Regulated Brokers
Trading Tips:
I still advise buying gold from every downward level while monitoring the factors affecting the market and avoiding risk, no matter how strong the trading opportunities seem, and distributing trading funds across several entry levels.
Will the Gold Price Rise in the Coming Days?
Gold market analysts believe that the current downward correction in gold prices is natural after the successive historical record gains in gold, which reached the $3500 per ounce resistance level at the end of April trading. They see the retreat as important for those looking to buy gold. On the technical side, the recent gold losses are sufficient to push the Relative Strength Index (RSI) steadily below the midline. At the same time, the MACD indicator confirms a downward shift. There are still opportunities for more losses before the technical indicators reach strong oversold levels.
The upward path for gold prices, according to the daily chart performance above, requires the return of gold bulls with prices to the resistance levels of $3285 and $3340 again.
The gold market today will be affected by the performance of the US dollar price, the extent of investors' risk appetite, and the state of global trade, economic, and political uncertainty, in addition to the volume of central bank purchases of gold bullion. This is alongside the reaction to the announcement of US economic data results, led by the release of the Producer Price Index (PPI) reading, US retail sales figures, and the number of weekly jobless claims, all of which will be announced today at 3:30 PM Egypt time. This is important data that affects market expectations for the future policies of the US Federal Reserve.
Why Did Gold Prices Decline?
The decline in gold prices comes as investors recently resorted to risk assets following the United States' conclusion of trade agreements with China and the United Kingdom. Also, demand for safe havens is declining as Ukraine and Russia prepare for ceasefire negotiations in Turkey on Thursday, while the military conflict between India and Pakistan ended with a ceasefire agreement over the weekend. Accordingly, commodity market experts believe that the ceasefire between Pakistan and India, along with the intense focus on a Russian Ukrainian solution, has helped calm geopolitical tensions, reducing the need for safe havens led by gold. According to experts, gold's downward momentum may continue for a few days, but the long-term bullish outlook remains intact.
Ready to trade our Gold price forecast? We’ve made a list of the best Gold trading platforms worth trading with.
