
Bullish view
- Buy the BTC/USD pair and set a take-profit at 113,000.
- Add a stop-loss at 106,000.
- Timeline: 1-2 days.
Bearish view
- Sell the BTC/USD pair and set a take-profit at 106,000.
- Add a stop-loss at 113,000.
Bitcoin price resumed its uptrend as demand for the coin continued rising. The BTC/USD pair rose to 110,000 from this week’s low of 106,610, with bulls targeting more gains to the all-time high of nearly 112,000.
Top Regulated Brokers
Bitcoin demand continues rising
There are signs that institutions are piling into Bitcoin. In a statement on Monday, Strategy, formerly known as MicroStrategy, said that it was bought addtional 4,020 coins, bringing its total holdings to 580,250 coins. Its Bitcoin holdings are now valued at over $60 billion, making it the biggest holder.
Trump Media Group, which runs Truth Social, also announced that it was raising $3 billion to acquire Bitcoin. $2 billion of these funds will be raised through a stock sale and the other $1 billion through a convertible bond.
Other companies have also started acquiring Bitcoin. For example, Twenty One Capital, a newly formed company is buying Bitcoin worth over $3.6 billion. The company is a partnership between Cantor Fitzgerald, Tether, and Softbank.
More companies that have seen Strategy’s success will likely start buying Bitcoin in the coming months. Many fund managers have started accumulating Bitcoin through the publicly traded ETFs. They include popular companies like Citadel, Millennium, and Susquehanna,
Spot Bitcoin ETFs have continued accumulating inflows, bringing the cumulative total to over $128 billion.
At the same time, Bitcoin’s supply continues falling, with balances held in exchanges continuing to fall. The same has happened in the over-the-counter market, where supply continues running out.
The BTC/USD pair continued rising as the trade war between the US and the European Union improved. After a call with Ursula von de Leyen, Trump decided to extend his deadline for a deal until July. A 50% tariff on European goods and the subsequent retaliation would have led to high recession risks.
BTC/USD technical analysis
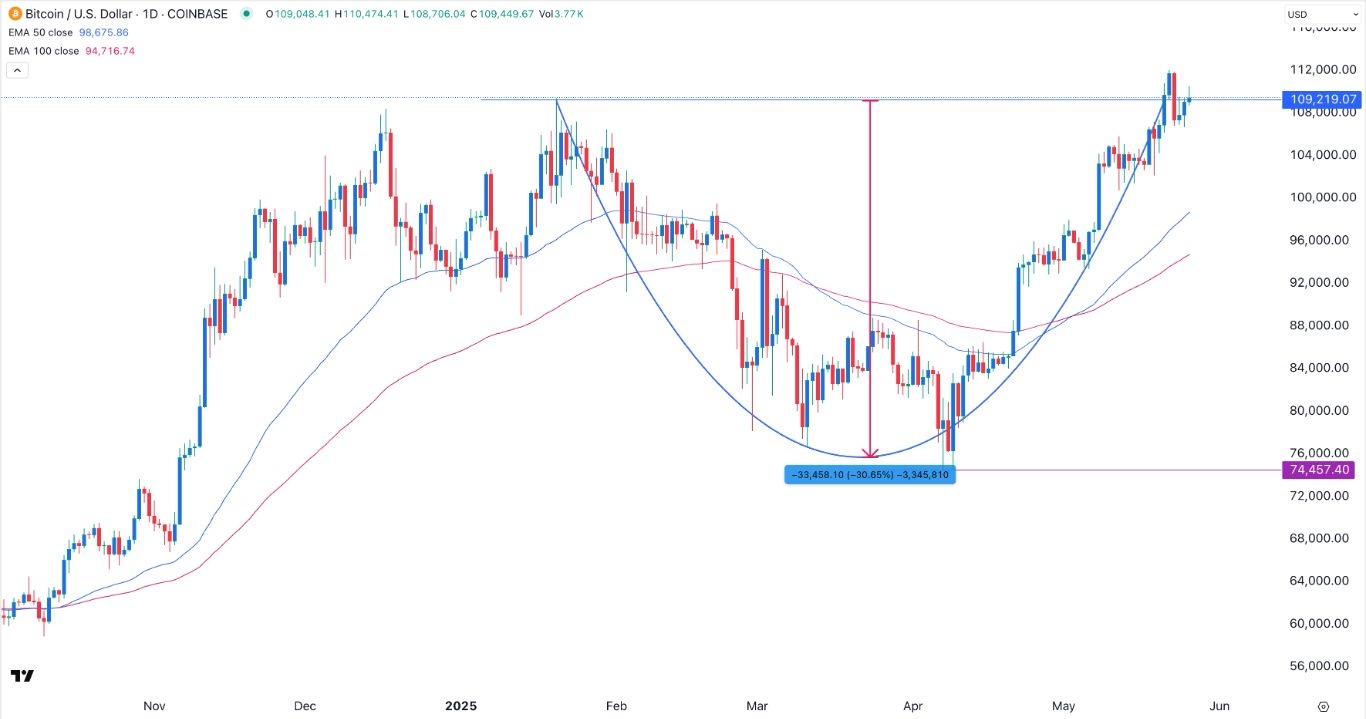
The daily chart shows that the BTC/USD pair bottomed at 74,457 on April 7 after Donald Trump delivered his “Liberation Day” speech. It then embarked on a strong rally that pushed it to a record high of 111,900 last week.
The most important formation is that it has formed a cup and handle pattern whose upper side is at 109,220. This pattern has a depth of of about 30%. As such, measuring the same distance from the cup’s upper side means that it may have a strong bullish breakout, potentially to over 140,000 in this bullish cycle. A drop below the support at 105,000 will invalidate the bullish outlook.
Ready to trade our free trading signals? We’ve made a list of the best Forex crypto brokers worth trading with.