My previous BTC/USD signal on 14th April was not triggered as none of the key support or resistance levels were reached that day.

Today’s BTC/USD Signals
Risk 0.50% per trade.
Trades may only be taken before 5pm Tokyo time Wednesday.
Long Trade Ideas
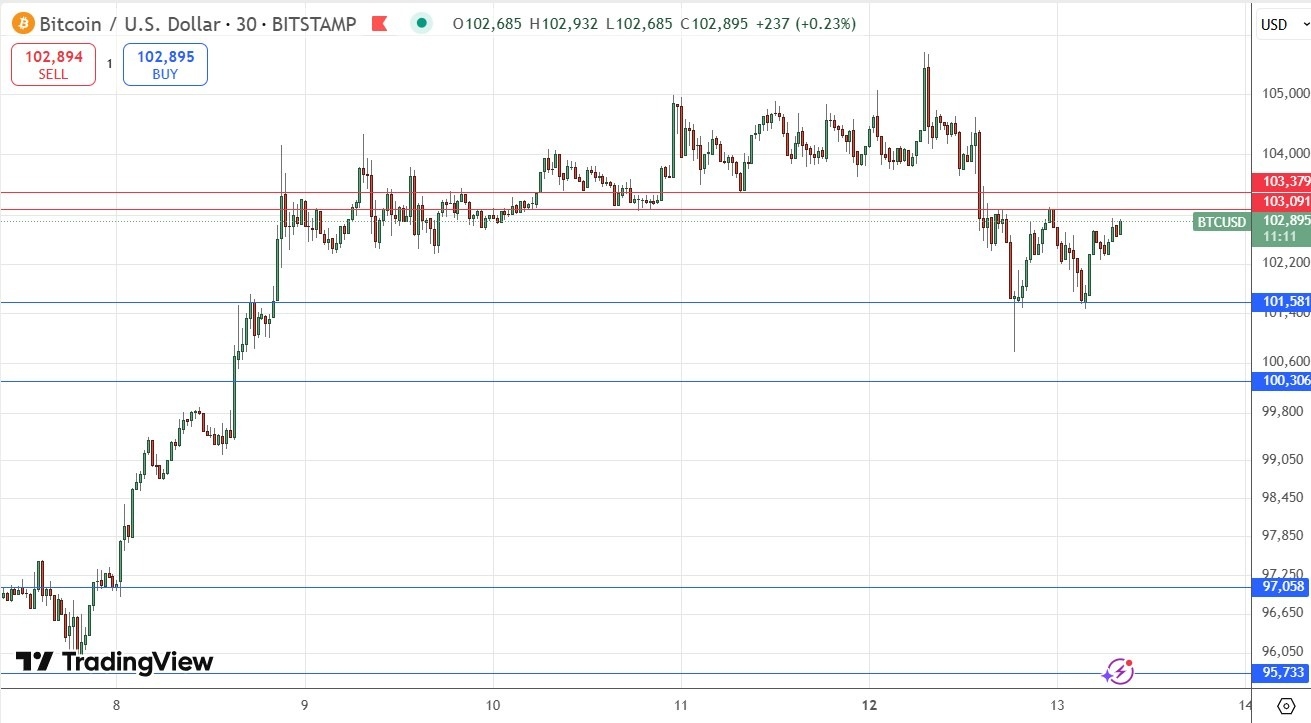
- Long entry after a bullish price action reversal on the H1 timeframe following the next touch of $101,581, $100,306, or $97,058.
- Place the stop loss $100 below the local swing low.
- Adjust the stop loss to break even once the trade is $100 in profit by price.
- Remove 50% of the position as profit when the trade is $100 in profit by price and leave the remainder of the position to ride.
Short Trade Ideas
- Short entry after a bearish price action reversal on the H1 timeframe following the next entry into the zone between of $103,091 and $103,379.
- Place the stop loss $100 above the local swing high.
- Adjust the stop loss to break even once the trade is $100 in profit by price.
- Remove 50% of the position as profit when the trade is $100 in profit by price and leave the remainder of the position to ride.
Top Regulated Brokers
The best method to identify a classic “price action reversal” is for an hourly candle to close, such as a pin bar, a doji, an outside or even just an engulfing candle with a higher close. You can exploit these levels or zones by watching the price action that occurs at the given levels.
BTC/USD Analysis
I wrote in my previous BTC/USD forecast on 14th April that every time the price got near $86,215 bulls faltered, so there might be a good opportunity for a short trade here.
This was true in the sense that the price was unable to rise above that level on the day, but not very accurate or useful as the price did not get very close to that level.
Almost one month later, the technical picture has become more bullish. Last week, the price made a bullish breakout beyond an area of persistent strong resistance above $95,000 and the price quickly reached well above the big round number at $100,000. It looked as though the price would go on to test the all-time high near $109,000 but, despite the risk-on rally following the USA/China trade deal, the price has fallen back, maybe because of the stronger US Dollar.
However, the price did find support at $101,581 which produced a bullish double bottom.
The price now looks set to challenge the zone of resistance between $103,091 and $103,379. This area looks likely to be a pivotal point.
So, I think a long trade following a confirmed bullish breakout beyond $103,379 could be a good trade. Alternatively, if the price penetrates into this zone and then makes a firm bearish reversal, a short trade might be interesting.
The outcome will probably depend to some extent on the US CPI (inflation) data release due early in today’ New York session, as it might significantly impact the Dollar if the annualized rate deviates significantly from the expected 2.4%.
There is nothing of high importance due today regarding Bitcoin. Concerning the US Dollar, there will be a release of US CPI (inflation) at 1:30pm London time.
Ready to trade our free Forex signals on Bitcoin? Here’s our list of the best MT4 crypto brokers worth reviewing.
