Singapore posted a disappointing June industrial production reading, resulting in pending downward revisions to the second-quarter GDP estimate. Factories nearly flatlined in June with a minor 0.2% increase against calls for a 10.3% surge. It represented the second monthly decline in output, suggesting the global economy is in materially worse shape than previously forecast. Core inflation remained negative for the fifth consecutive month, confirming a lack of domestic demand. The USD/SGD is likely to enter a brief counter-trend advance before resuming its sell-off with a renewed breakdown.
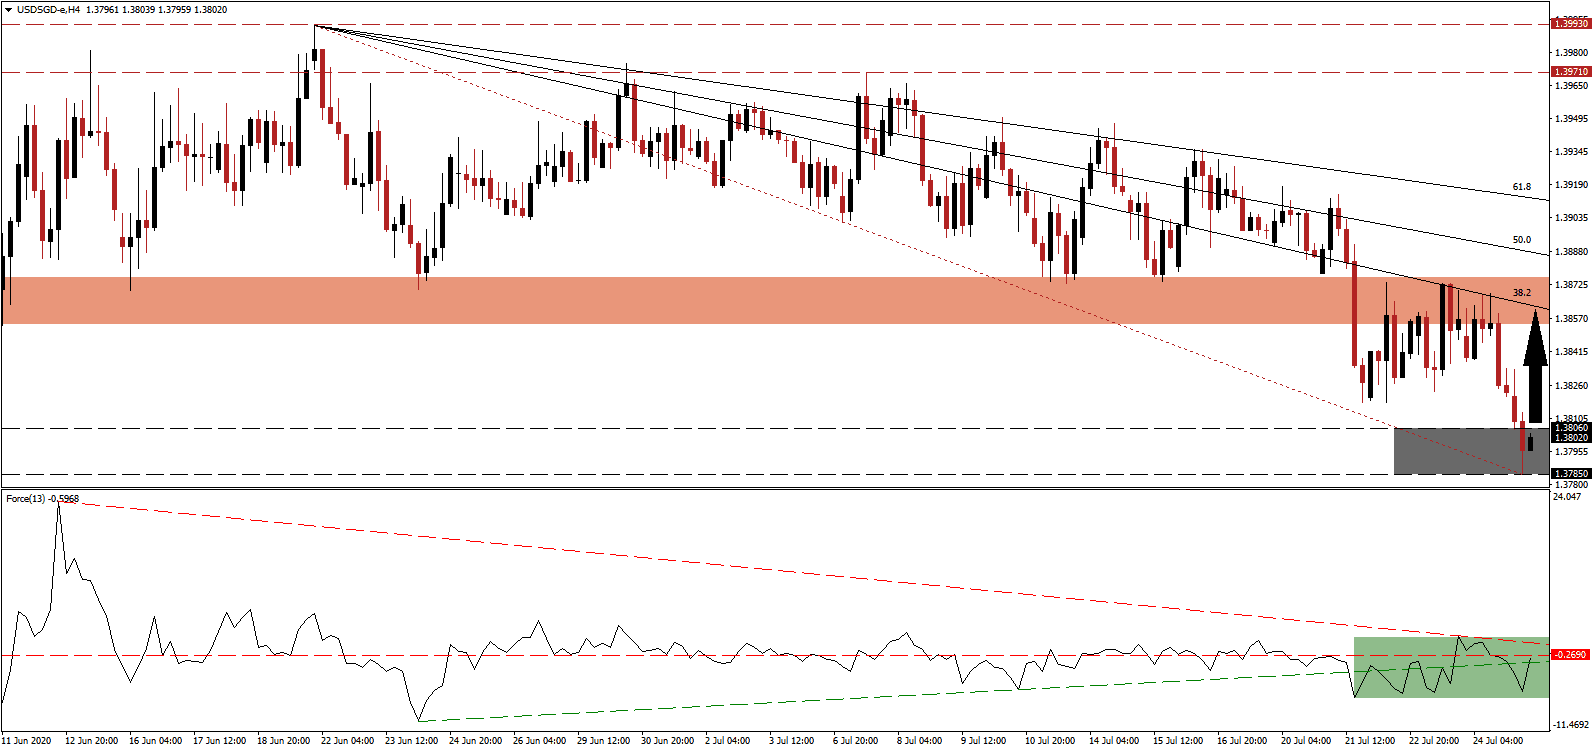
The Force Index, a next-generation technical indicator, confirms the presence of mild bullish momentum after reclaiming its ascending support level, as marked by the green rectangle. It is presently challenging its horizontal resistance level, while the descending resistance level is enhancing a bearish momentum build-up. This technical indicator remains below the 0 center-line, allowing bears to maintain control of the USD/SGD.
Permanent changes to industries and consumer behavior may allow Singapore to conduct a long-overdue inward-looking economic recalibration. With the city-state already in a recession, it may inspire a more diversified approach due to the collapse in global trade, which is expected to make only a partial recovery in 2021. Regionalization is gaining traction once again, ideally positioning Singapore as a prime benefactor of it. The USD/SGD may face a limited short-covering rally following a breakout above its support zone located between 1.3785 and 1.3806, marked by the grey rectangle, before resuming its correction.
Last week saw an uptick in US initial jobless claims, just as the weekly $600 government subsidy expired. Republicans will announce their fifth proposed stimulus package, with an estimated price tag of $1 trillion in additional debt, and a reduction in the financial aid to the unemployed. The combination limits the upside potential in the USD/SGD to its downward revised short-term resistance zone located between 1.3854 and 1.3876, as identified by the red rectangle. The descending 38.2 Fibonacci Retracement Fan Resistance Level is favored to enforce the long-term downtrend in this currency pair.
USD/SGD Technical Trading Set-Up - Short-Covering Scenario
Long Entry @ 1.3800
Take Profit @ 1.3855
Stop Loss @ 1.3770
Upside Potential: 55 pips
Downside Risk: 30 pips
Risk/Reward Ratio: 1.83
In case the descending resistance level pressures the Force Index into a reversal, the USD/SGD is likely to resume its well-established downtrend. Forex traders should consider any advance from current levels as an excellent selling opportunity, driven by intensifying bearish pressures on the US Dollar. Price action will test its next support zone between 1.3567 and 1.3604.
USD/SGD Technical Trading Set-Up - Breakdown Extension Scenario
Short Entry @ 1.3740
Take Profit @ 1.3570
Stop Loss @ 1.3770
Downside Potential: 170 pips
Upside Risk: 30 pips
Risk/Reward Ratio: 5.67

