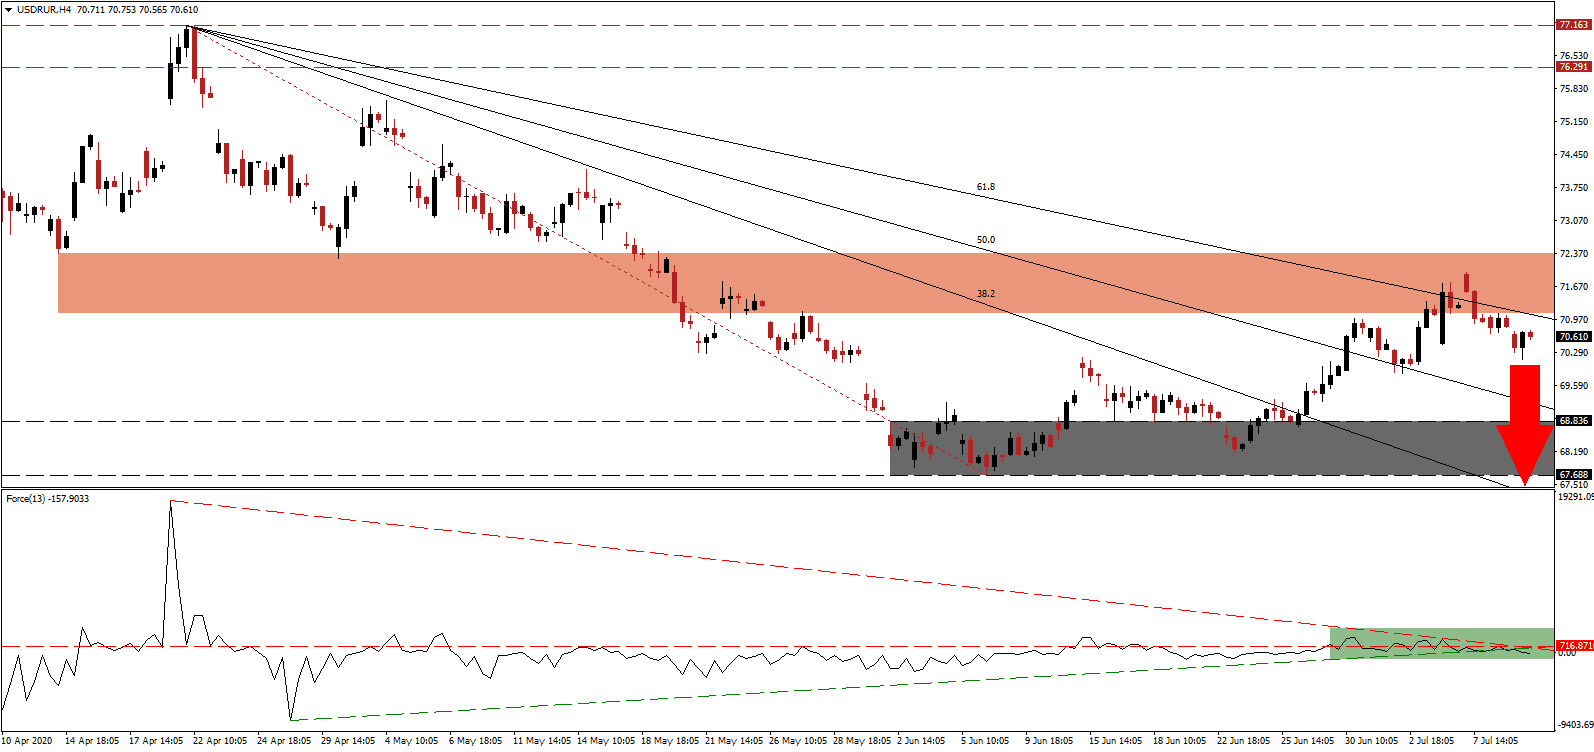
Russia is forecast to contract by 6.0% in 2020 due to the Covid-19 pandemic, the worst decline since 2009. With oil demand faltering, Russia’s primary export is under pressure, with a ripple effect across the economy. A 6.0% will be worse than the 5.2% global GDP drop, but better than most European economies. The outlook for 2021 and 2022 is cautiously optimistic, with expected growth rates of 2.7% and 3.1%, respectively, but it does confirm a long road to pre-crisis levels. The USD/RUB ended its healthy counter-trend advance with a breakdown below its short-term resistance zone.
The Force Index, a next-generation technical indicator, confirms the dominance of bearish pressures after being pushed below its horizontal resistance level by its descending resistance level. It is now moving farther away from its ascending support level, as marked by the green rectangle. Bears have regained full control of the USD/RUB since this technical indicator moved into negative territory.
Bank of Russia Elvira Nabiullina is moderately more optimistic than the World Bank, confirming to the State Duma that the Covid-19 downturn will be less severe than that following the 2008 global financial crisis. The central bank reduced interest rates by 100 basis points to 4.5% in June, the first cut since 2015. After the USD/RUB completed a breakdown below its short-term resistance zone located between 71.101 and 72.374, as marked by the red rectangle, bearish pressures accumulated with a move below its descending 61.8 Fibonacci Retracement Fan Support Level, converting it to resistance.
With the pandemic in the US out of control, the US Dollar is under intensifying breakdown pressures. The $600 weekly government subsidy to initial jobless claims will expire this month, and more debt-funded relief is presently being debated. Localized shutdowns remain an increased likelihood, adding to economic stress. The USD/RUB is well-positioned to accelerate into its support zone located between 67.688 and 68.836, as identified by the grey rectangle. From there, the Fibonacci Retracement Fan sequence is favored to guide price action into its next support zone between 63.749 and 64.953.
USD/RUB Technical Trading Set-Up - Breakdown Extension Scenario
Short Entry @ 70.600
Take Profit @ 63.750
Stop Loss @ 72.000
Downside Potential: 6,850 pips
Upside Risk: 1,400 pips
Risk/Reward Ratio: 4.89
A breakout in the Force Index above its descending resistance level is likely to result in a more temporary upside in the USD/RUB. Forex traders are recommended to take advantage of more upside with new net short positions due to an expanding bearish outlook for the US economy, in conjunction with political uncertainty. The upside potential is limited to its intra-day high of 74.126 from where the corrective phase gathered downside momentum.
USD/RUB Technical Trading Set-Up - Limited Breakout Scenario
Long Entry @ 72.700
Take Profit @ 74.100
Stop Loss @ 72.000
Upside Potential: 1,400 pips
Downside Risk: 700 pips
Risk/Reward Ratio: 2.00

