Mexican gross fixed investment plunged a record 28.9% in April over March, in seasonally adjusted terms. In unadjusted terms, April’s year-over-year collapse clocked in at 36.9%, the most significant drop since the 1995 Mexican Peso crisis, also referred to as the Tequila crisis. President López Obrador remains fiscally conservative, resisting calls to spike debt levels, and pushing ahead with his economic agenda. The International Monetary Fund (IMF) predicts the Mexican economy will face a 10.5% GDP slump in 2020, while the USD/MXN is well-positioned to extend its breakdown sequence, partially driven by US Dollar weakness.
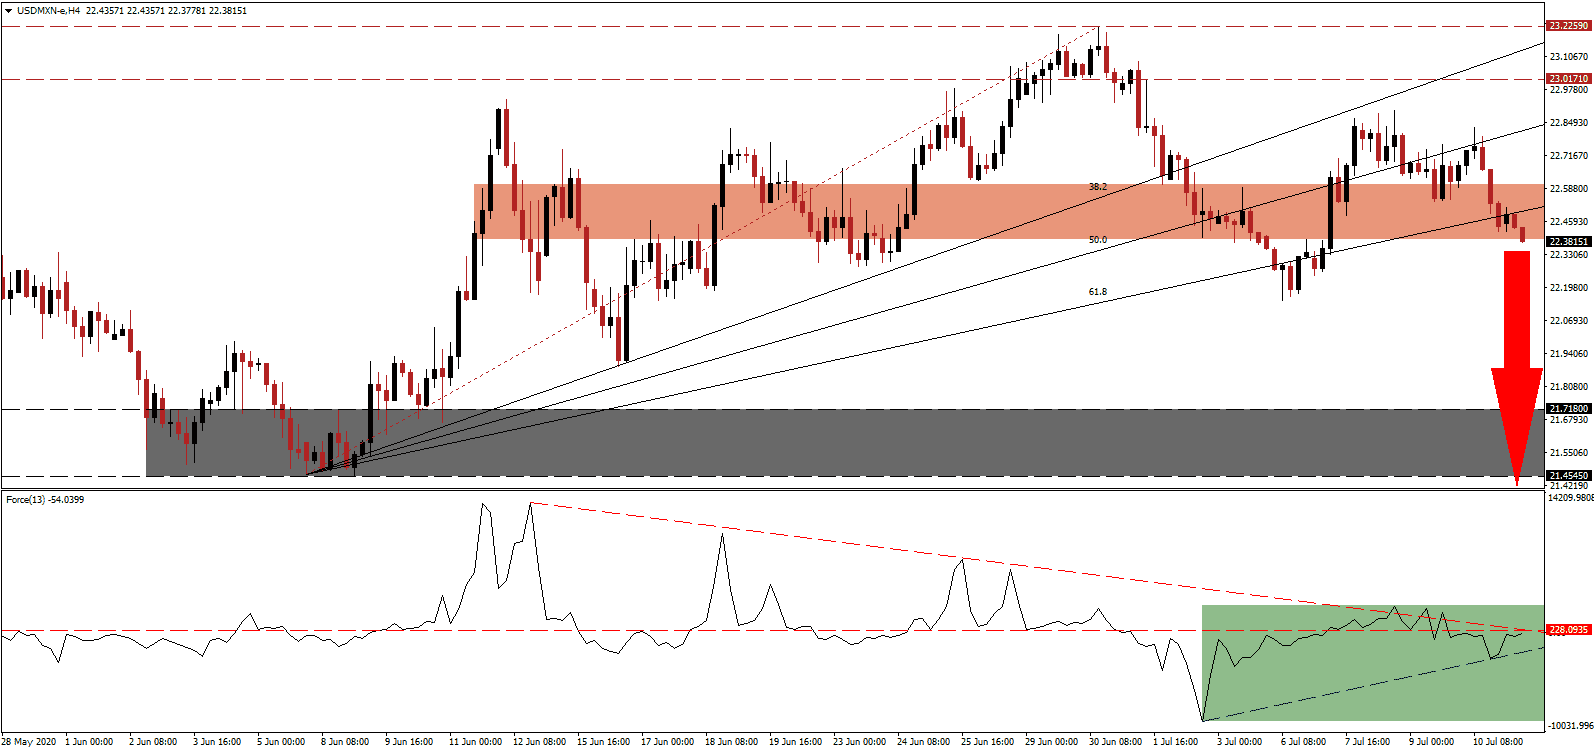
The Force Index, a next-generation technical indicator, recorded a lower high during its temporary counter-trend advance, resulting in an adjustment to the ascending support level. Bearish pressures remain dominant, and the horizontal resistance level is likely to reject a further advance. Adding to breakdown pressures is the descending resistance level, as marked by the green rectangle. With this technical indicator below the 0 center-line, bears remain in charge of the USD/MXN.
Critics of Mexican President López Obrador claim that his promise of transformation resulted in an economic disaster, magnified by the global Covid-19 pandemic. Mexico has the potential to capitalize on pending supply-chain adjustments but has to tackle crime to entice companies to locate manufacturing into Mexico. The US-Mexico-Canada Agreement may additionally shift more of the $1.2 trillion annualized trade flow between the three countries towards Mexico. After reversing the brief advance, the USD/MXN resumed its downtrend and is presently challenging the bottom range of its short-term resistance zone located between 22.3891 and 22.6044, as marked by the red rectangle.
Global economic recovery projections for 2021 are continuously revised lower, while the 2020 contraction figures are revised higher. With Covid-19 cases surging since countries lifted lockdown measures, led by the out-of-control situation in the US, more downward revisions are likely. While the economy slows, debt levels are soaring, and a potential crisis is brewing. The breakdown in the USD/MXN below its ascending 61.8 Fibonacci Retracement Fan Support Level, converting it into resistance, expanded bearish pressures. Price action is now clear to accelerate into its support zone located between 21.4545 and 21.7180, as identified by the grey rectangle, with more downside probable.
USD/MXN Technical Trading Set-Up - Breakdown Extension Scenario
Short Entry @ 22.3800
Take Profit @ 21.4500
Stop Loss @ 22.6000
Downside Potential: 9,300 pips
Upside Risk: 2,200 pips
Risk/Reward Ratio: 4.23
Should the Force Index accelerate above its descending resistance level, the USD/MXN may attempt to push higher. The upside potential is limited to its long-term resistance zone located between 23.0171 and 23.2259, which will grant Forex traders a secondary short-selling opportunity to consider. Bearish progress for the US economy is on the rise, and more debt will add to downside pressure in the US Dollar.
USD/MXN Technical Trading Set-Up - Limited Breakout Scenario
Long Entry @ 22.7800
Take Profit @ 23.1300
Stop Loss @ 22.6000
Upside Potential: 3,500 pips
Downside Risk: 1,800 pips
Risk/Reward Ratio: 1.94

