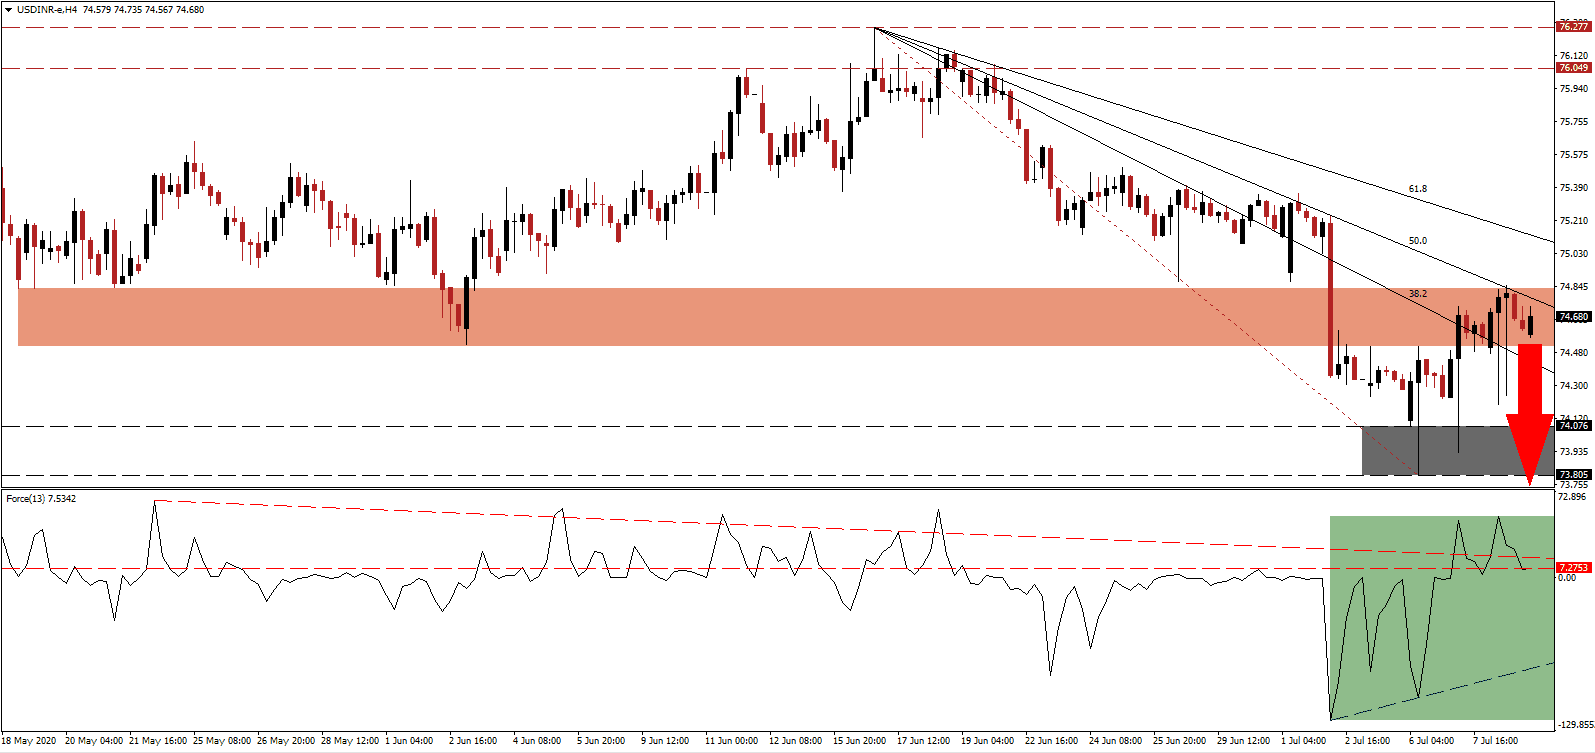
India began to ease lockdown restrictions related to the Covid-19 pandemic on June 8th and witnessed a surge in new infections since then. It is the third-most infected country globally, trailing the US and Brazil, and the most infected country in Asia. Data including power generation, port activity, and traffic congestion point to an expected rise in economic activity over the past four weeks, but it does compare against depressed levels. Additionally, it will likely fasten the spread of the virus as it has in other countries. The US is setting new daily records after states ignored guidelines and rushed to reopen the economy. A brief count-trend advance took the USD/INR back into its short-term resistance zone, favored to attract a new wave of selling.
The Force Index, a next-generation technical indicator, confirmed the temporary rally but has since reversed below its horizontal resistance level, as marked by the green rectangle. A collapse below its ascending support level is expected, with the descending resistance level increasing downside pressure. Bears wait for this technical indicator to move below the 0 center-line to magnify their building dominance over the USD/INR.
While the Covid-19 pandemic poses short-to-medium-term problems for the government to tackle, a recent independent study by Oxford Economics outlined that if India fails to address its current environmental policy, the economy could collapse 90% by 2100 from current levels. The present situation created a unique opportunity for India to implement sustainable modifications. Following the move by the USD/INR into its short-term resistance zone located between 74.514 and 74.834, as identified by the red rectangle, breakdown pressures are on the rise.
Adding a bearish catalyst to this currency pair is the rise in initial and continuing jobless claims out of the US. Numerous economic reports delivered on the headline, but the employment components remained depressed. An extension of this trend in today’s data will pressure the US Dollar to the downside. The USD/INR was rejected by its descending 50.0 Fibonacci Retracement Fan Resistance Level from where price action is anticipated to correct into its support zone located between 73.805 and 74.076, as marked by the grey rectangle. Given the intensifying stress on the US economy, a collapse into its next support zone between 72.695 and 73.303 is probable.
USD/INR Technical Trading Set-Up - Breakdown Scenario
Short Entry @ 74.650
Take Profit @ 72.700
Stop Loss @ 75.050
Downside Potential: 19,500 pips
Upside Risk: 4,000 pips
Risk/Reward Ratio: 4.88
A breakout in the Force Index above its descending resistance level could inspire the USD/INR into a breakout. The absence of a federal response in the US resulted in state governors and municipalities issuing varying mandatory guidelines, creating different economic environments across the country, often described as chaotic by the business community. Forex traders are advised to sell any rallies from present levels with the upside potential limited to its intra-day high of 75.357, a significant pivot point.
USD/INR Technical Trading Set-Up - Limited Breakout Scenario
Long Entry @ 75.150
Take Profit @ 75.350
Stop Loss @ 75.050
Upside Potential: 2,000 pips
Downside Risk: 1,000 pips
Risk/Reward Ratio: 2.00

