India struggled with a slowing economy before the outbreak of the Covid-19 pandemic forced a nationwide lockdown. June data points towards a marginal improvement as compared to the previous two months but confirms the extensive damage from the virus-related measures as compared to last year. India implemented a failed campaign to revive a faltering economy in August 2019, focused on the supply side, and ignoring domestic demand issues. Prime Minister Modi now has a chance to rectify past policy errors. More downside in the USD/INR is favored after a temporary price spike halted the breakdown sequence.
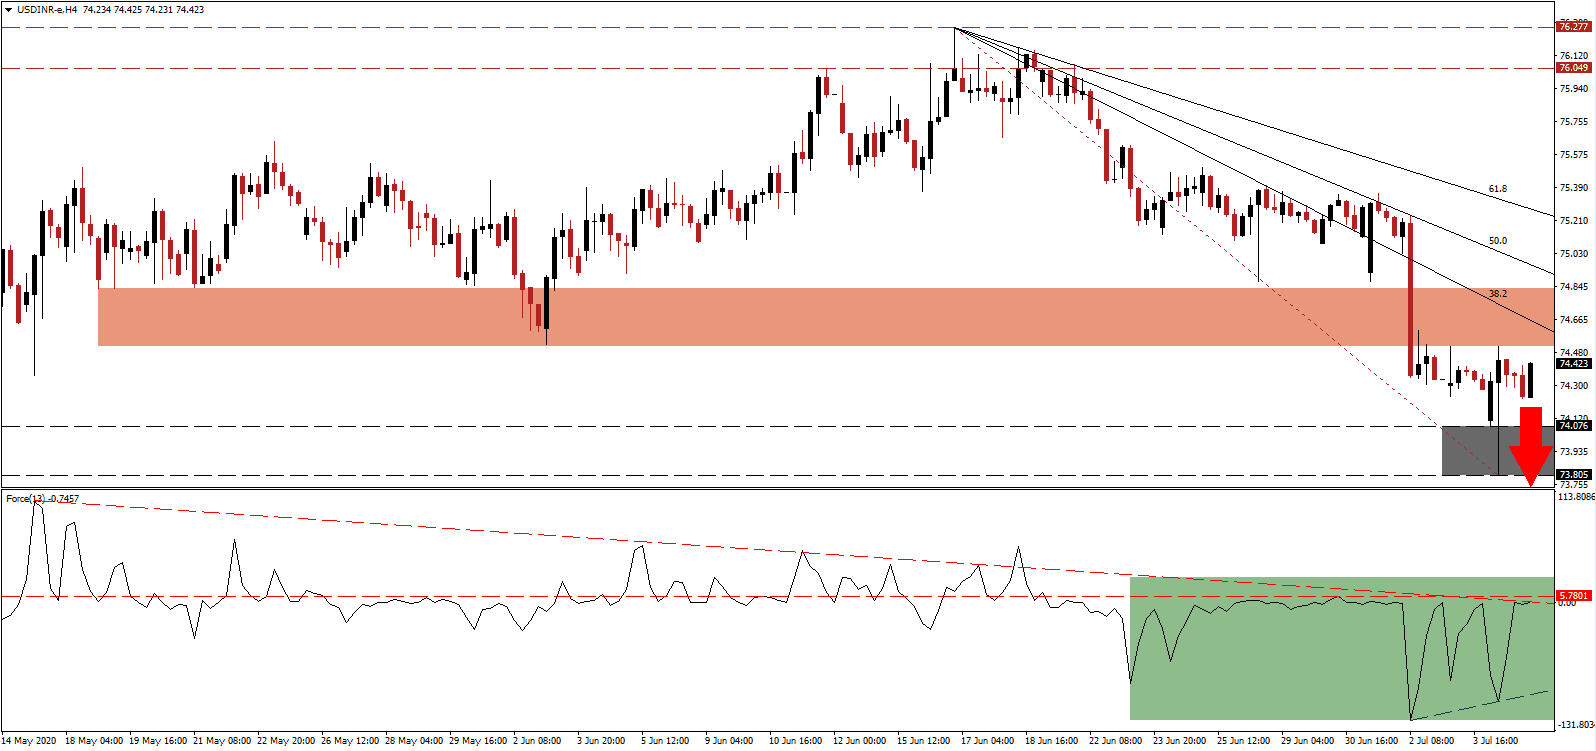
The Force Index, a next-generation technical indicator, collapsed to a new multi-week low before recovering. Three attempts to push higher were rejected by the horizontal resistance level, as marked by the green rectangle, confirming bearish momentum dominance. Adding to downside pressure is the descending resistance level. Bears are in control of the USD/INR with this technical indicator in negative territory and positioned to correct below its ascending support level.
While the global economy faces a prolonged period of slow recovery, permanent adjustments to the supply chain, and changes in consumer behavior, it also presents a unique opportunity for governments to adjust and recalibrate their economic framework. Those willing to make necessary adjustments will emerge as a more dominant economy. Cautious optimism remains that India will implement proper reforms. The short-term resistance zone in the USD/INR was revised lower to reflect the expanding bearish pressures and is presently located between 74.514 and 74.834, as marked by the red rectangle.
California is the latest US state to retrace the premature rush to reopen its economy. The US struggles with an out-of-control pandemic, the stimulus is running out, and the government plans to add more debt-funded economic relief. It maintains the downward spiral, pressuring the US Dollar farther to the downside. The descending 38.2 Fibonacci Retracement Fan Resistance Level is expected to push the USD/INR back down into its support zone located between 73.805 and 74.076, as identified by the grey rectangle. A breakdown into its next support zone between 72.695 and 73.303 is likely to emerge.
USD/INR Technical Trading Set-Up - Breakdown Extension Scenario
Short Entry @ 74.400
Take Profit @ 72.700
Stop Loss @ 74.900
Downside Potential: 27,000 pips
Upside Risk: 5,000 pips
Risk/Reward Ratio: 5.40
Should the Force Index eclipse its descending resistance level, the USD/INR may extend its reversal. The quickly deteriorating US economic conditions and crumbling labor market limits the upside potential to 61.8 Fibonacci Retracement Fan Resistance Level. Forex traders are advised to take advantage of any push higher with new net short positions, with a bearish outlook on the US Dollar.
USD/INR Technical Trading Set-Up - Limited Breakout Scenario
Long Entry @ 75.000
Take Profit @ 75.200
Stop Loss @ 74.900
Upside Potential: 2,000 pips
Downside Risk: 1,000 pips
Risk/Reward Ratio: 2.00

