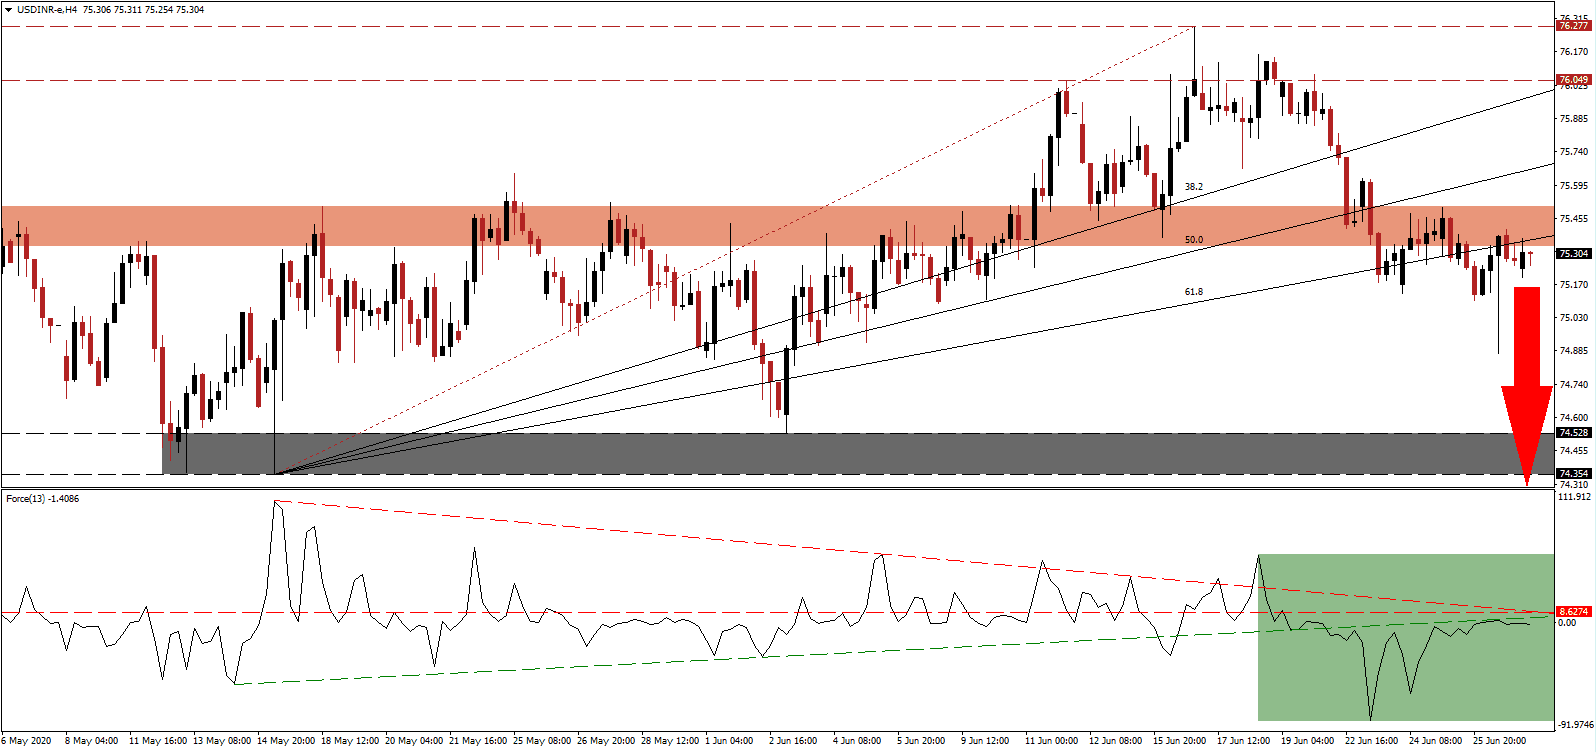
Indian Prime Minister Narendra Modi banks on India’s domestic economy to overcome the devastating impact of the Covid-19 pandemic. Supply chain disruptions delivered a significant blow to India’s import reliant manufacturing sector. It shows early signs of positive results. Before the virus, India faced a shortage of personal protective equipment (PPE). In two months, it became the second-biggest producer of PPE globally, trailing China. It adds to long-term bearish drivers in the USD/INR, where more downside is anticipated following the most recent breakdown below its short-term resistance zone.
The Force Index, a next-generation technical indicator, recovered from a new multi-week low but was rejected by its ascending support level, as marked by the green rectangle. It remains below its horizontal resistance level with the descending resistance level expanding downside pressures. Bears are in complete control of the USD/INR with this technical indicator below the 0 center-line.
Following the clash at the Indo-China border, leaving 20 troops dead, pressure on Prime Minister Modi to replicate the PPE success is on the rise. Indian companies, previously hesitant to replace cheap Chinese imports, comprised a list of 3,000 items, which can be produced domestically. A wave of economic nationalism emerged, favoring to create jobs and develop a domestic cycle to offset higher production costs. After the USD/INR corrected below its short-term resistance zone located between 75.333 and 75.504, as identified by the red rectangle, price action is on course to extend its correction.
It may lead to India reconsidering the exit of negotiations of the Regional Comprehensive Economic Partnership (RCEP). It walked out in November 2019, citing essential obstacles. The Covid-19 pandemic and pending permanent adjustments to global supply chains have changed the narrative. Increasing bearish pressures on the USD/INR is the breakdown below its ascending 61.8 Fibonacci Retracement Fan Support Level, converting it into resistance. Price action is expected to accelerate into its support zone located between 74.354 and 74.528, as marked by the grey rectangle, from where more downside is likely.
USD/INR Technical Trading Set-Up - Breakdown Extension Scenario
Short Entry @ 75.300
Take Profit @ 74.300
Stop Loss @ 75.600
Downside Potential: 10,000 pips
Upside Risk: 3,000 pips
Risk/Reward Ratio: 3.33
Should the Force Index reclaim its ascending support level, serving as resistance, the USD/INR could recover to the upside. The upside potential is limited to its resistance zone located between 76.049 and 76.277, offering Forex traders an excellent secondary selling opportunity. Intensifying negative progress out of the US economy adds a distinct bearish fundamental catalyst.
USD/INR Technical Trading Set-Up - Restricted Breakout Scenario
Long Entry @ 75.750
Take Profit @ 76.050
Stop Loss @ 75.600
Upside Potential: 3,000 pips
Downside Risk: 1,500 pips
Risk/Reward Ratio: 2.00

