India and China are attempting to defuse the border conflict at Galwan River valley peacefully after a brawl left dozens of troops dead. With anti-Chinese protests across India raging, the dependence on China is becoming evident. The Indian government is identifying areas to reduce its reliance on Chinese imports. One controversial sector is the defense industry, particularity after the deadly border clash. Over 50,000 bulletproof vests for the Indo Tibetan Border Force (ITBP), responsible or securing the Line of Actual Control (LAC) where the conflict erupted, are sourced from Chinese raw materials. The USD/INR currently remains unfazed by the developments but maintains its most recent breakdown.
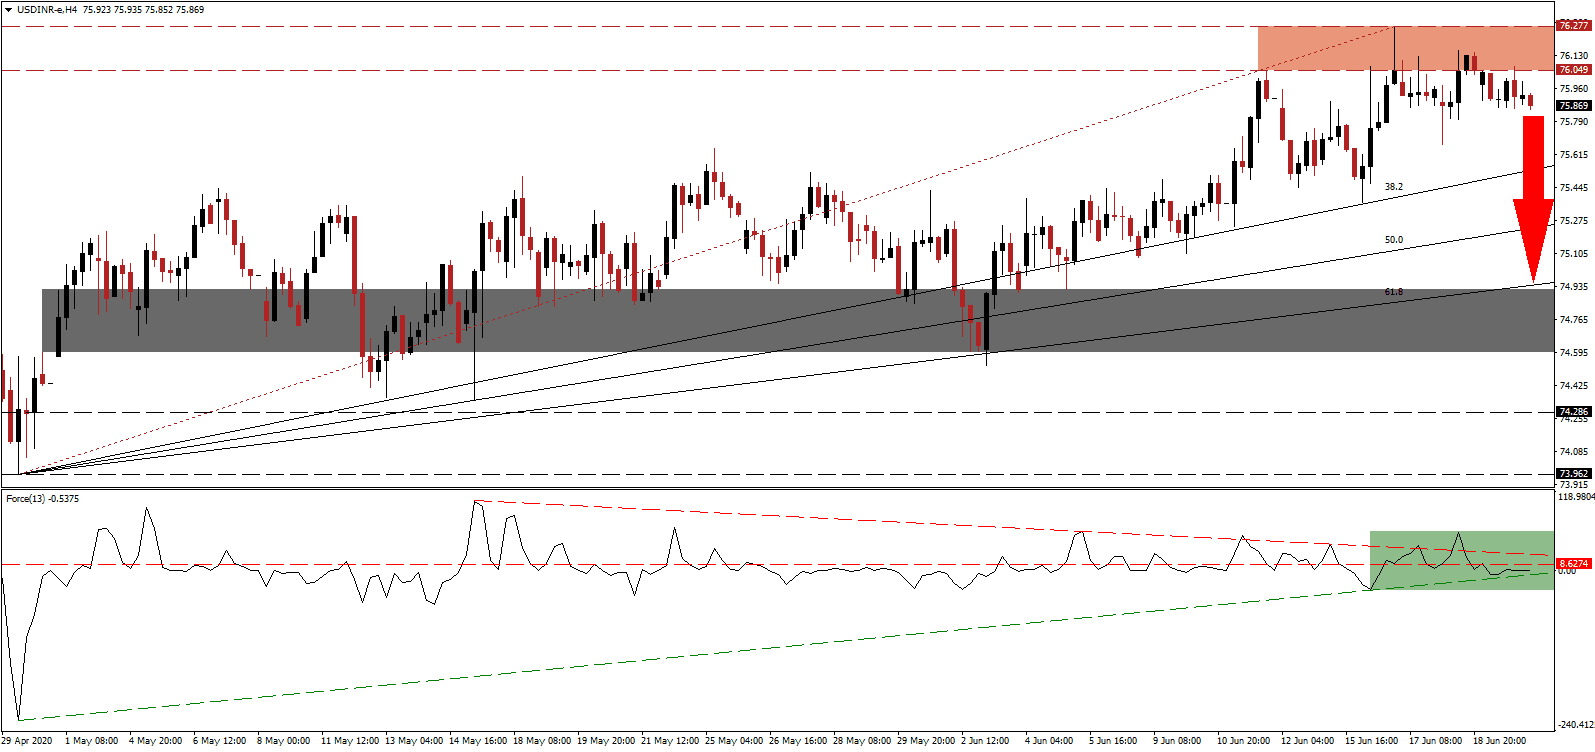
The Force Index, a next-generation technical indicator, reversed a brief spike above its descending resistance level and moved below its horizontal resistance level. While the ascending support level is exercising bullish pressures, as marked by the green rectangle, the twin resistance level is anticipated to reject the Force Index. Bears regained control over the USD/INR after this technical indicator contracted into negative territory.
China’s support of the Indian economy is tremendous, making a significant change in the relationship unlikely. The problem is magnified as there is no viable alternative for India. Bilateral trade surged from roughly $3 billion in 2000 to nearly $96 billion in 2018 but contracted to around $93 billion in 2019. The Indian government, running a massive trade deficit with China, prefers to reduce imports further, which could result in retaliatory measures and harm the Indian economy. Despite negative progress, a more massive corrective phase is favored following the breakdown in the USD/INR below its resistance zone located between 76.049 and 76.277, as identified by the red rectangle, fueled by US Dollar weakness.
Foreign direct investment by China into India, per unofficial statistics, is rumored around $8 billion, with $5.5 billion funding the vibrant Indian start-up sector, specifically technology. While consumers openly protest after the deadliest border conflict in 45 years, they do so with Chinese technology as 75% of the mobile phone market relies on it. A resolution between the nuclear-armed neighbors remains the most probable outcome. In a bright spot for the Indian economy, the e-commerce order book recovered 90% from its Covid-19 low. It positions the USD/INR for a sell-off into its ascending 61.8 Fibonacci Retracement Fan Support Level, which exited the short-term support zone located between 74.595 and 74.919, as marked by the grey rectangle.
USD/INR Technical Trading Set-Up - Breakdown Extension Scenario
Short Entry @ 75.850
Take Profit @ 74.950
Stop Loss @ 76.150
Downside Potential: 9,000 pips
Upside Risk: 3,000 pips
Risk/Reward Ratio: 3.00
In the event the Force Index is pressured higher by its ascending support level, the USD/INR could challenge its resistance zone. Given the worsening economic outlook out of the US, any breakout attempt in this currency pair is vulnerable to a swift reversal. Forex traders are recommended to take advantage of a potential price spike with new net short positions. The next resistance zone awaits between 76.433 and 76.769.
USD/INR Technical Trading Set-Up - Limited Breakout Scenario
Long Entry @ 76.450
Take Profit @ 76.750
Stop Loss @ 76.300
Upside Potential: 3,000 pips
Downside Risk: 1,500 pips
Risk/Reward Ratio: 2.00

