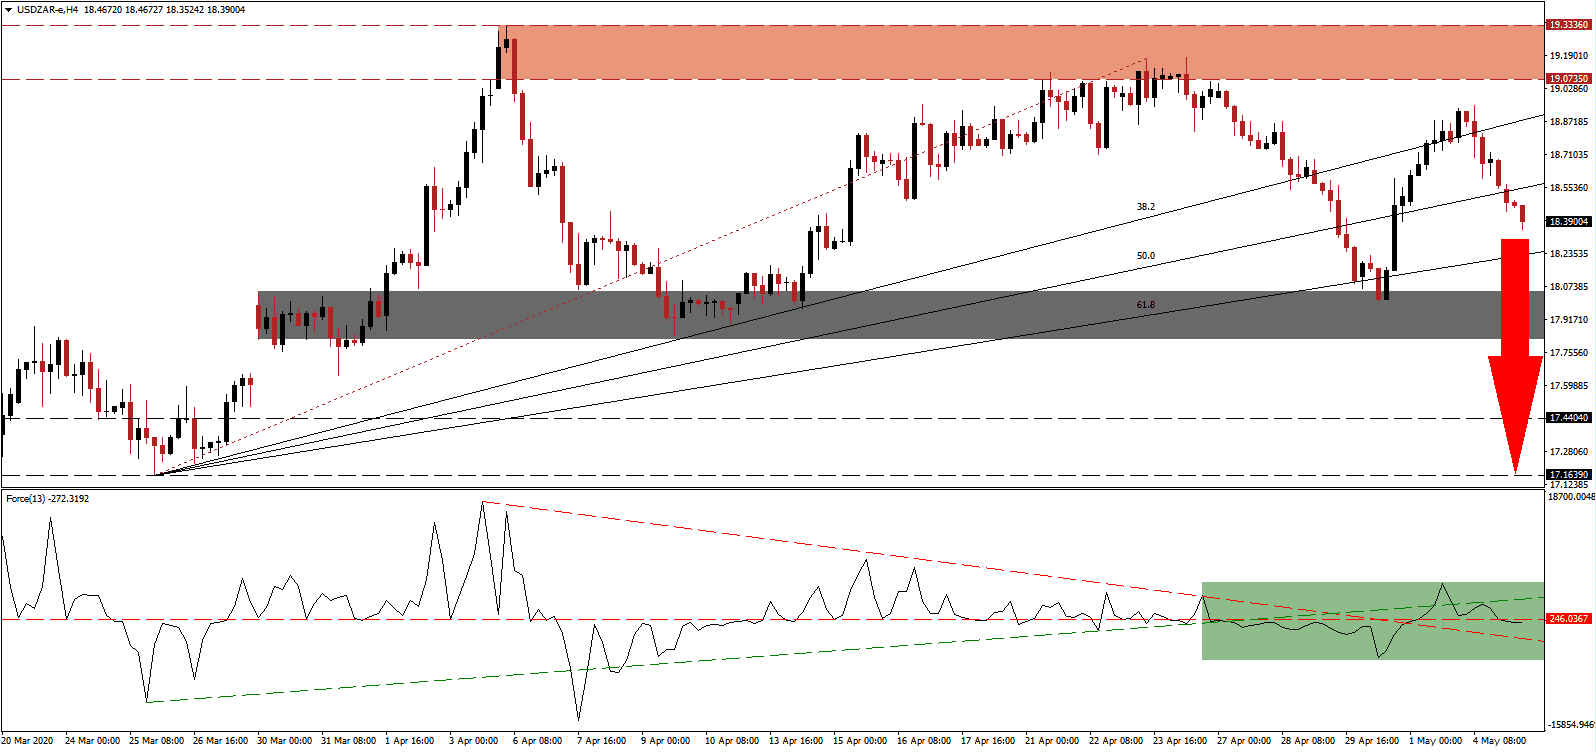
US Factory orders for March came in below already depressed expectations, continuing the series of worse than forecast economic reports. It highlights more severe fundamental problems, while the Trump administration merely seeks to borrow more and increase the mountain of debt. Failure to make painful adjustments will result in significant challenges, as the US economy is ill-prepared for a slow recovery. New tariff threats against China are adding additional stress to the outlook. The USD/ZAR is amid a continuation of its breakdown sequence after recording a lower high during its previous advance.
The Force Index, a next-generation technical indicator, corrected below its ascending support level. It was followed by a conversion of its horizontal support level into resistance, as marked by the green rectangle. Bearish pressures increased after this technical indicator crossed below the 0 center-line, ceding control of the USD/ZAR to bears. A breakdown below the descending resistance level, serving as short-term support, is favored to accelerate the corrective phase. You can learn more about the Force Index here.
South Africa announced an R500 billion stimulus, but more is projected as Africa’s second-largest economy is forecast to enter a long and slow recovery that may exceed 24 months. The global Covid-19 pandemic is forcing the government to address permanent adjustments to the tax and labor code, generating a long-term bullish catalyst for the USD/ZAR. After the lower high in price action, below the resistance zone located between 19.0735 and 19.3336, as identified by the red rectangle, more downside is anticipated.
This currency pair converted its ascending 50.0 Fibonacci Retracement Fan Support Level into resistance, which added to bearish developments in the USD/ZAR. A collapse into its short-term support zone located between 17.8202 and 18.0513, as marked by the grey rectangle, is likely to materialize. Given a weakening US outlook, a breakdown into the next support zone located between 17.1639 and 17.4404 cannot be excluded. Volatility may increase as price action extends its series of lower highs and lower lows, establishing a distinct bearish chart pattern moving forward.
USD/ZAR Technical Trading Set-Up - Breakdown Extension Scenario
Short Entry @ 18.3900
Take Profit @ 17.2250
Stop Loss @ 18.6900
Downside Potential: 11,650 pips
Upside Risk: 3,000 pips
Risk/Reward Ratio: 3.88
In the event of a recovery in the Force Index above its ascending support level, serving as intermediary resistance, the USD/ZAR could reverse. The upside potential remains limited to its 38.2 Fibonacci Retracement Fan Resistance Level and the bottom range of its resistance zone. While South Africa’s uncertain short-term challenges cannot be ignored, the long-term outlook is increasingly bullish. Forex traders should consider any price spike as an outstanding selling opportunity.
USD/ZAR Technical Trading Set-Up - Limited Reversal Scenario
Long Entry @ 18.8400
Take Profit @ 19.0700
Stop Loss @ 18.7400
Upside Potential: 2,300 pips
Downside Risk: 1,000 pips
Risk/Reward Ratio: 2.30

