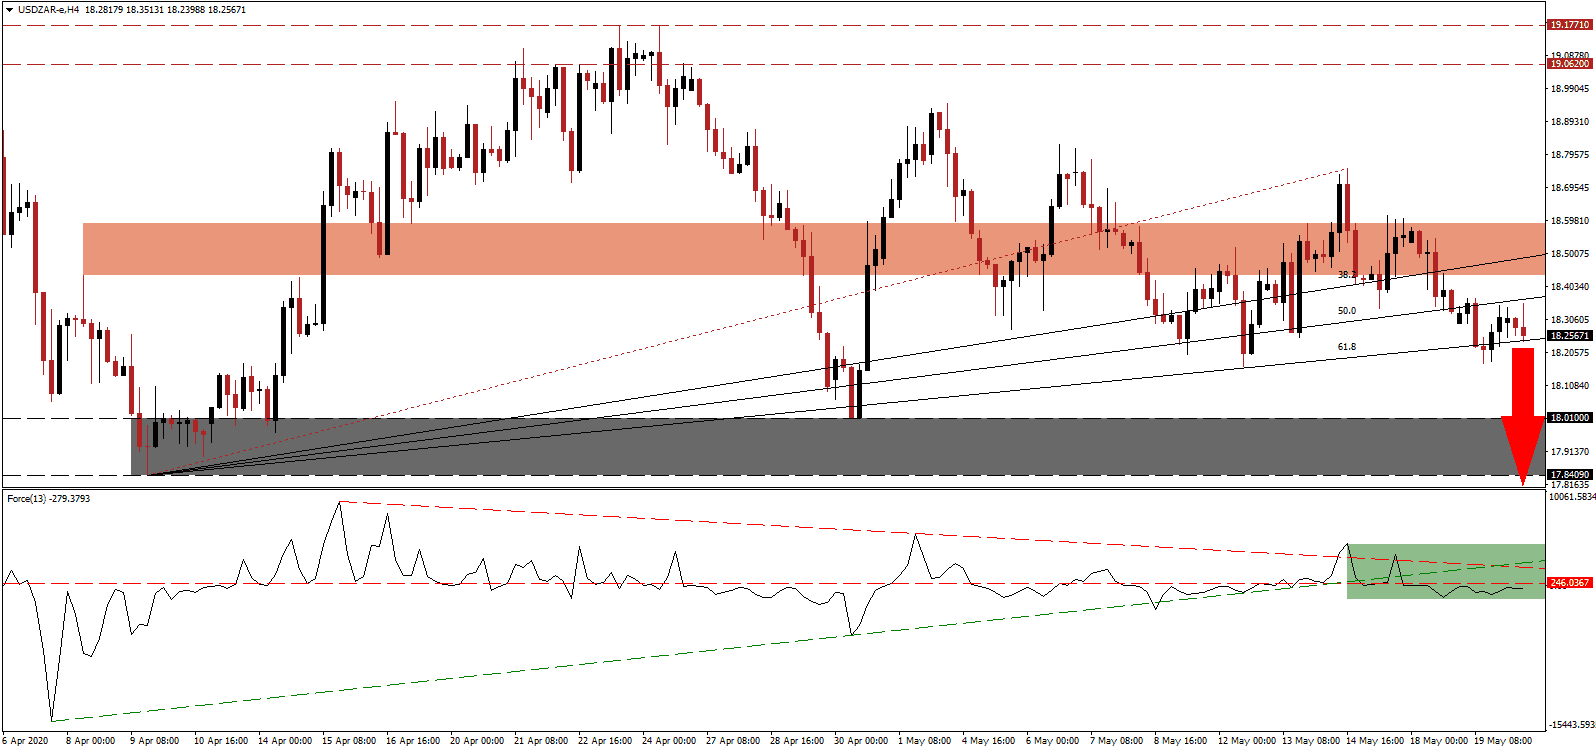
South Africa is in the process of gradually returning to a modified social and economic life. Major business hubs were infection rates are elevated will lag the rest of the country. Africa’s second-biggest economy, as measured by GDP and the most industrialized country, is also home to the broadest degree of inequality. While numerous factors contribute to the divide, the Covid-19 pandemic presents the country with an opportunity to implement necessary reforms to develop a more inclusive economy. The R500 billion stimulus bought limited time for the government to chart the proper course. Cautious optimism remains, and the USD/ZAR formed a bearish chart pattern favored to extend the breakdown sequence.
The Force Index, a next-generation technical indicator, points towards bearish momentum and maintains its position below the horizontal resistance level, as marked by the green rectangle. Following the collapse in the Force Index below its ascending support level, downside pressures expanded, which is increased by its descending resistance level. Bears remain in full control of the USD/ZAR with this technical indicator in negative territory.
Yesterday’s February mining production data surprised to the upside while declining as compared to January, while annualized gold production surged. Since the nationwide lockdown did not take effect until March, a severe plunge is anticipated. The USD/ZAR established a bearish chart pattern with a series of lower highs, with US government above $25 trillion and household debt exceeding $14 trillion, adding a long-term bearish catalyst. After the breakdown in price action below the short-term resistance zone located between 18.4367 and 18.5894, as identified by the red rectangle, downside momentum increased.
This currency pair is now on the verge of a breakdown below its ascending 61.8 Fibonacci Retracement Fan Support Level. It will clear the path for an accelerated sell-off in the USD/ZAR, on the back of an expected increase in volume, until it can challenge its support zone located between 17.8409 and 18.0100, as marked by the grey rectangle. With the US adding to its debt load, where annualized interest payments exceed $1 trillion, more than the overall burden of the South African government, an extension of the corrective phase is probable. The next support zone is located between 17.1639 and 17.3563.
USD/ZAR Technical Trading Set-Up - Breakdown Extension Scenario
Short Entry @ 18.2500
Take Profit @ 17.1700
Stop Loss @ 18.5500
Downside Potential: 10,800 pips
Upside Risk: 3,000 pips
Risk/Reward Ratio: 3.60
In the event the Force Index pushes above its ascending support level, serving as resistance, the USD/ZAR is likely to come under upside pressure. With the US unwilling to implement changes, while adding to its debt with a new proposed $3 trillion economic assistance package, the upside potential is limited to its intra-day high of 18.7517. Forex traders are recommended to take advantage of any price spike with new net short positions.
USD/ZAR Technical Trading Set-Up - Limited Breakout Scenario
Long Entry @ 18.6000
Take Profit @ 18.7500
Stop Loss @ 18.5250
Upside Potential: 1,500 pips
Downside Risk: 750 pips
Risk/Reward Ratio: 2.00

