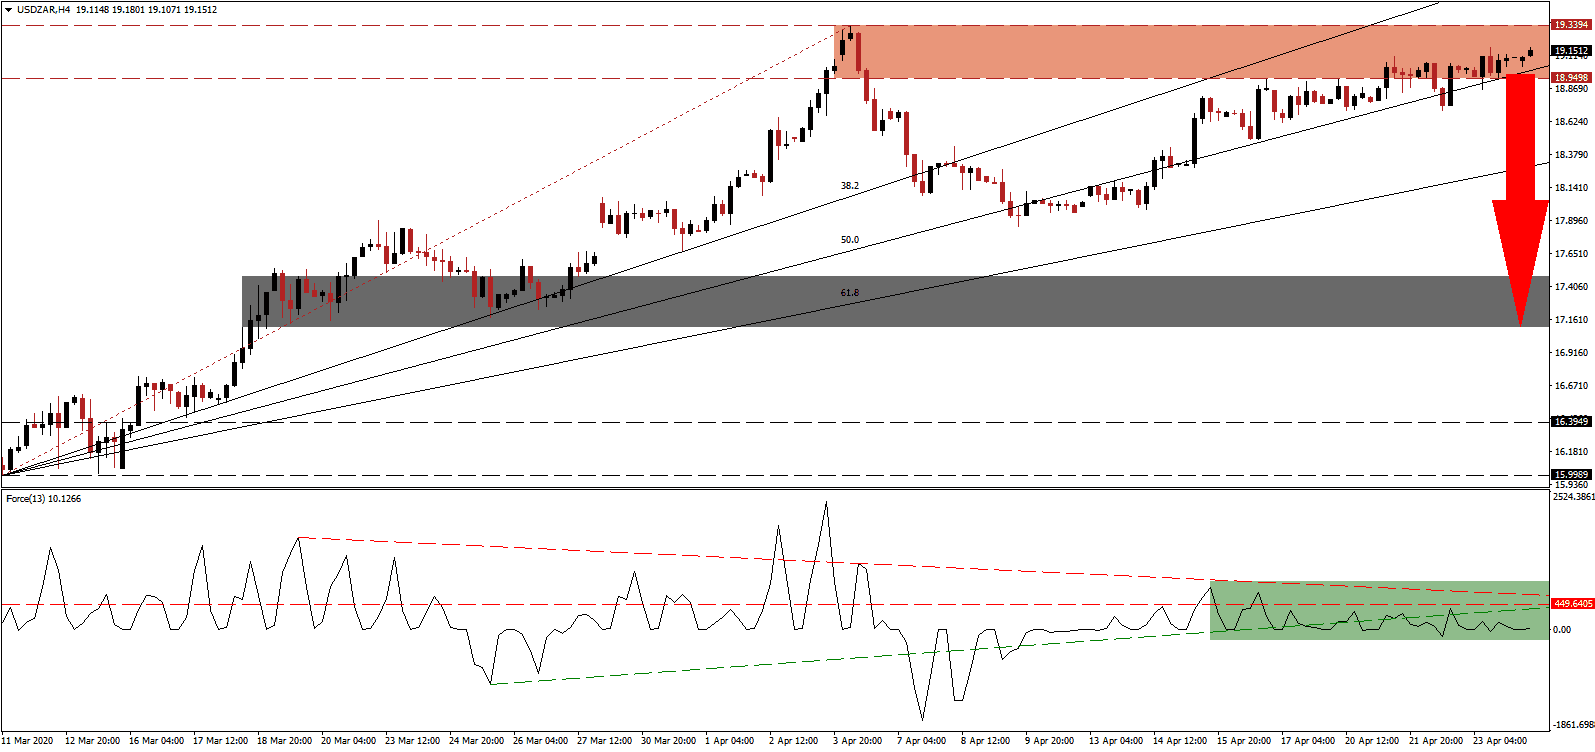
Short-term concerns pressured the US Dollar higher as liquidity concerns remain, and the US Federal Reserve is printing money at a record pace. Markets are presently ignoring the long-term ramifications of the US central bank, which creates a massive problem for the recovery prospects of its economy. South Africa is being forced into identifying lasting changes to its economic model, positioning the country on a path to sustained recovery. President Ramaphosa notes a gradual reopening if Africa’s second-largest economy. The US, principally due to its central bank, failed to realize the opportunity to improve fundamentals, favoring to incur more debt, hoping it will deliver results. While the USD/ZAR drifted marginally higher after reaching its resistance zone, breakdown pressures rose equally.
The Force Index, a next-generation technical indicator, continues its slow contraction, resulting in the emergence of a negative divergence, which is a bearish trading signal. Bearish momentum increased after the Force Index moved below its ascending support level, as marked by the green rectangle. The descending resistance level is adding to breakdown pressures in the USD/ZAR, and once it moves below the horizontal resistance level, price action is anticipated to follow suit. This technical indicator is on the verge of crossing below the 0 center-line, ceding control to bears.
South Africa has required a comprehensive tax overhaul and labor market reforms. Politicians delayed necessary measures, but are now forced to address them. It creates a positive fundamental catalyst moving forward, but the R500 billion stimulus is adding to short-term debt concerns. Volatility may increase with the USD/ZAR testing the strength of its resistance zone located between 18.9498 and 19.3394, as identified by the red rectangle. US economic reports clock in worse than economists forecast while new infections show little sign of easing significantly. It suggests a prolonged economic disruption.
Forex traders are advised to monitor the ascending 50.0 Fibonacci Retracement Fan Support Level carefully. It entered the resistance zone, pushing the 38.2 Fibonacci Retracement Fan Support Level above it. A breakdown below it is expected to end the rally, forcing a profit-taking sell-off in the USD/ZAR. Weak US economic data is likely to overshadow concerns out of South Africa, adding a fundamental driver. The next short-term support zone is located between 17.1024 and 17.4770, as marked by the grey rectangle. You can learn more about a profit-taking sell-off here.
USD/ZAR Technical Trading Set-Up - Profit-Taking Scenario
Short Entry @ 19.1500
Take Profit @ 17.1500
Stop Loss @ 19.6000
Downside Potential: 20,000 pips
Upside Risk: 4,500 pips
Risk/Reward Ratio: 4.44
A breakout in the Force Index above its descending resistance level could temporarily extend the advance in the USD/ZAR. Mounting US job losses, the collapse in regional economic activity, and misappropriation of stimulus capital, significantly impact the upside potential. The next resistance zone is located between 20.4061 and 20.6123, and Forex traders are recommended to consider this a secondary entry-level to existing short positions.
USD/ZAR Technical Trading Set-Up - Limited Breakout Scenario
Long Entry @ 19.7500
Take Profit @ 20.5000
Stop Loss @ 19.4000
Upside Potential: 7,500 pips
Downside Risk: 3,500 pips
Risk/Reward Ratio: 2.14

