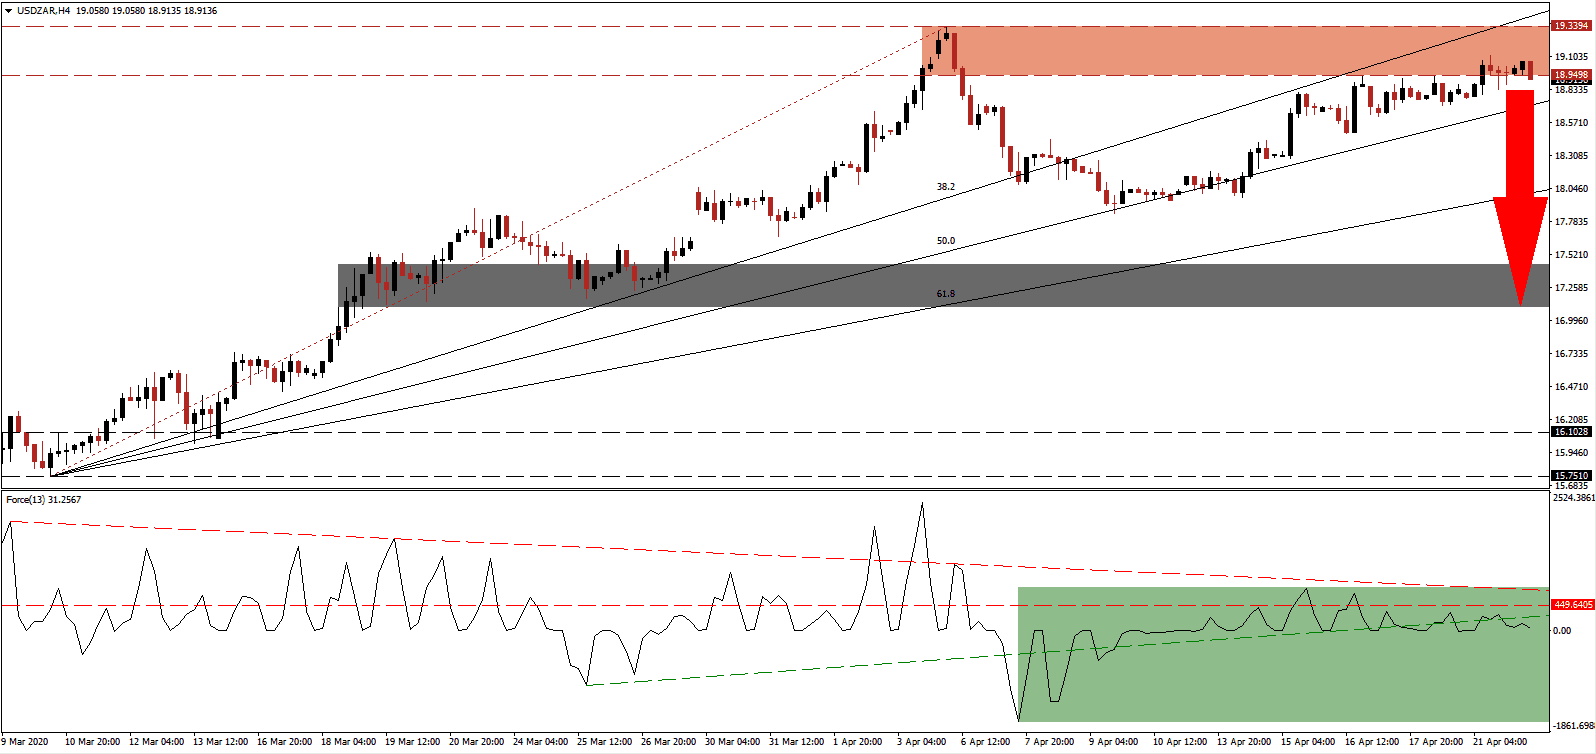
South Africa announced an unprecedented R500 billion economic stimulus in response to the global Covid-19 pandemic. It will boost government spending from 0.1% of GDP to approximately 10.0%. R130 billion will be sourced from the 2020 budget, R30 billion from the domestic Unemployment Insurance Fund for a specific National Disaster Benefit Fund, and the remaining R360 billion will be raised in global financial markets. Africa’s second-largest economy is planning to keep the nation under lockdown for an extended period, followed by a slow process to lift restrictions. As the USD/ZAR drifted into its resistance zone, bullish momentum faded, and a sell-off is anticipated to emerge.
The Force Index, a next-generation technical indicator, shows the gradual contraction in momentum while price action advanced, resulting in a negative divergence. It serves as an early signal that a price action reversal is imminent. The Force Index maintains its position below its horizontal resistance level and its ascending support level, as marked by the green rectangle, with the descending resistance level adding to breakdown pressures. Bears will regain control of the USD/ZAR after this technical indicator moves into negative territory.
While the South African government acknowledges existing debt levels are unsustainable, the US is in a similar position after adding $2.3 trillion to its total. Markets welcomed the massive stimulus packages announced around the globe, but the attention will soon shift to the costs and negative long-term impacts. The USD/ZAR is moving out of its resistance zone located between 18.9498 and 19.3394, as marked by the red rectangle. Negative progress out of the US is accumulating, enhanced by the oil price collapse, providing a fundamental catalyst for this profit-taking sell-off.
One essential level to monitor is the ascending 50.0 Fibonacci Retracement Fan Support Level, especially after the 61.8 Fibonacci Retracement Fan Resistance Level crossed above the top range of its resistance zone. A breakdown is expected to provide the trigger for an extended corrective phase on the back of a collapse in the US labor market and support system. The USD/ZAR is well-positioned to correct into its short-term support zone located between 17.1024 and 17.4395, as identified by the grey rectangle.
USD/ZAR Technical Trading Set-Up - Profit-Taking Scenario
Short Entry @ 18.9000
Take Profit @ 17.1500
Stop Loss @ 19.3500
Downside Potential: 17,500 pips
Upside Risk: 4,500 pips
Risk/Reward Ratio: 3.89
Should the Force Index accelerate above its descending resistance level, the USD/ZAR is likely to attempt a push to the upside. Forex traders are recommended to consider any breakout as a temporary event and an outstanding selling opportunity. Tomorrow’s US initial jobless claims data could provide the next bearish fundamental catalyst. The next resistance zone is located between 20.4061 and 20.6123.
USD/ZAR Technical Trading Set-Up - Limited Breakout Scenario
Long Entry @ 19.5000
Take Profit @ 20.5000
Stop Loss @ 19.0000
Upside Potential: 10,000 pips
Downside Risk: 5,000 pips
Risk/Reward Ratio: 2.00

