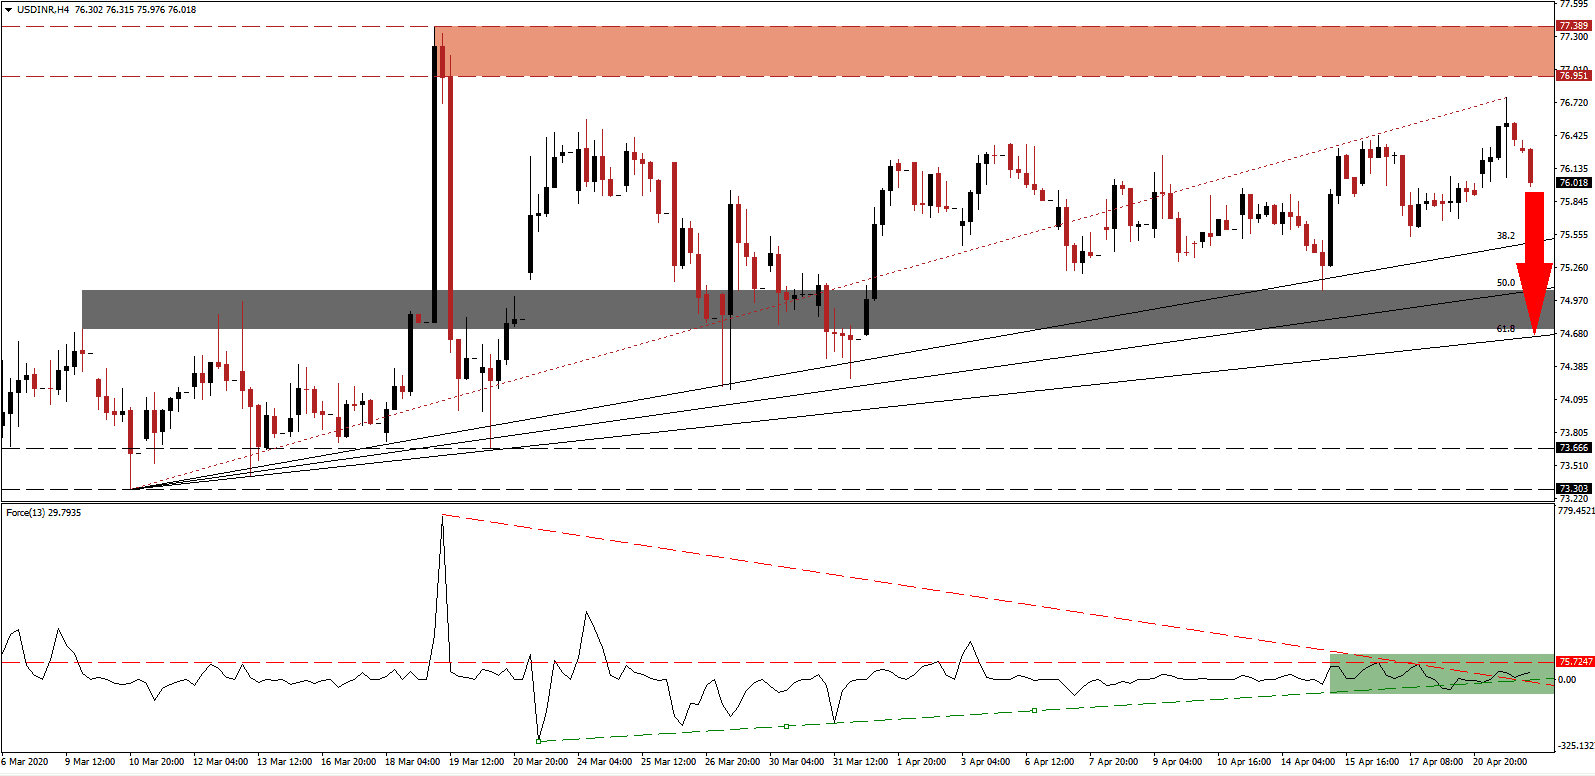
India’s 2021 fiscal year projection by the International Monetary Fund forecasts a 7.6% GDP expansion, while the 2020 fiscal year ending March 2021 is predicted to show a 1.9% growth rate. It assumes a series of extreme positive developments, making it vulnerable to disappointments. The global Covid-19 pandemic forced nationwide lockdowns across the world, but India reports a steady rise of infection. Over 20,000 confirmed cases were identified, and more are anticipated. The government announced a $22.6 billion stimulus to assist millions of daily wage earners who are unable to provide for their families, the majority active in the grey sector of India’s economy. Price action in the USD/INR is amid a correction after failing to reach its resistance zone.
The Force Index, a next-generation technical indicator, confirms the absence of bullish momentum to drive this currency pair farther to the upside. The Force Index was able to reclaim its ascending support level after eclipsing its descending resistance level, as marked by the green rectangle, but remains below its horizontal resistance level. A reversal is expected to pressure this technical indicator into negative territory, ceding control of the USD/INR to bears, and accelerating the breakdown.
This currency pair failed to retest its resistance zone located between 76.951 and 77.389, as identified by the red rectangle. The current breakdown in the USD/INR represents the sixth collapse in bullish pressures, suggesting US bearish fundamental conditions remain dominant. Where the labor market in the US is collapsing, expected to show over 30 million lost jobs by the end of April, rural India needs to address the upcoming rabi crop harvest. Income from agriculture is a significant economic catalyst, and the government is likely to announce measures to ensure adequate food supply.
Calls for more stimulus out of India is unlikely to be met, as the government attempts to walk a fine line between assisting those in need without sacrificing future economic performance. The US favored spiking its already unsustainable debt mountain in an uncontrolled method. Flaws of the lack in planning are already evident, as large companies are claiming funds intended for small businesses. Given the present fundamental outlook, the USD/INR is on track to challenge its short-term support zone located between 74.716 and 75.059. The ascending 61.8 Fibonacci Retracement Fan Support Level is enforcing it.
USD/INR Technical Trading Set-Up - Breakdown Extension Scenario
Short Entry @ 76.020
Take Profit @ 74.720
Stop Loss @ 76.420
Downside Potential: 13,000 pips
Upside Risk: 4,000 pips
Risk/Reward Ratio: 3.25
In case the ascending support level inspires more upside in the Force Index, the USD/INR is likely to attempt a seventh advance into its resistance zone. With US economic frustrations anticipated to continue, the upside potential remains limited to the top range of its long-term resistance zone. Forex traders are advised to endure caution, but the risks are to the downside, and any breakout presents a selling opportunity.
USD/INR Technical Trading Set-Up - Limited Breakout Scenario
Long Entry @ 76.820
Take Profit @ 77.320
Stop Loss @ 76.570
Upside Potential: 5,000 pips
Downside Risk: 2,500 pips
Risk/Reward Ratio: 2.00

