Optimism about the economic recovery potential remains elevated and prone to disappointment. Initial jobless claims are the primary data point highlighting the disconnect between predictions, hope, and reality. Over the past three weeks, 16.8 million initial jobless claims were reported, exceeding the most pessimistic outlook by far. It accounts for roughly 10% of the workforce, and the trend is anticipated to continue for several weeks. An unemployment rate of over 20%, while temporary, will require an extended period to recover, delivering an essential blow to consumer confidence. The USD/MXN is favored to extend its breakdown sequence on the back of persistent US economic disappointments.

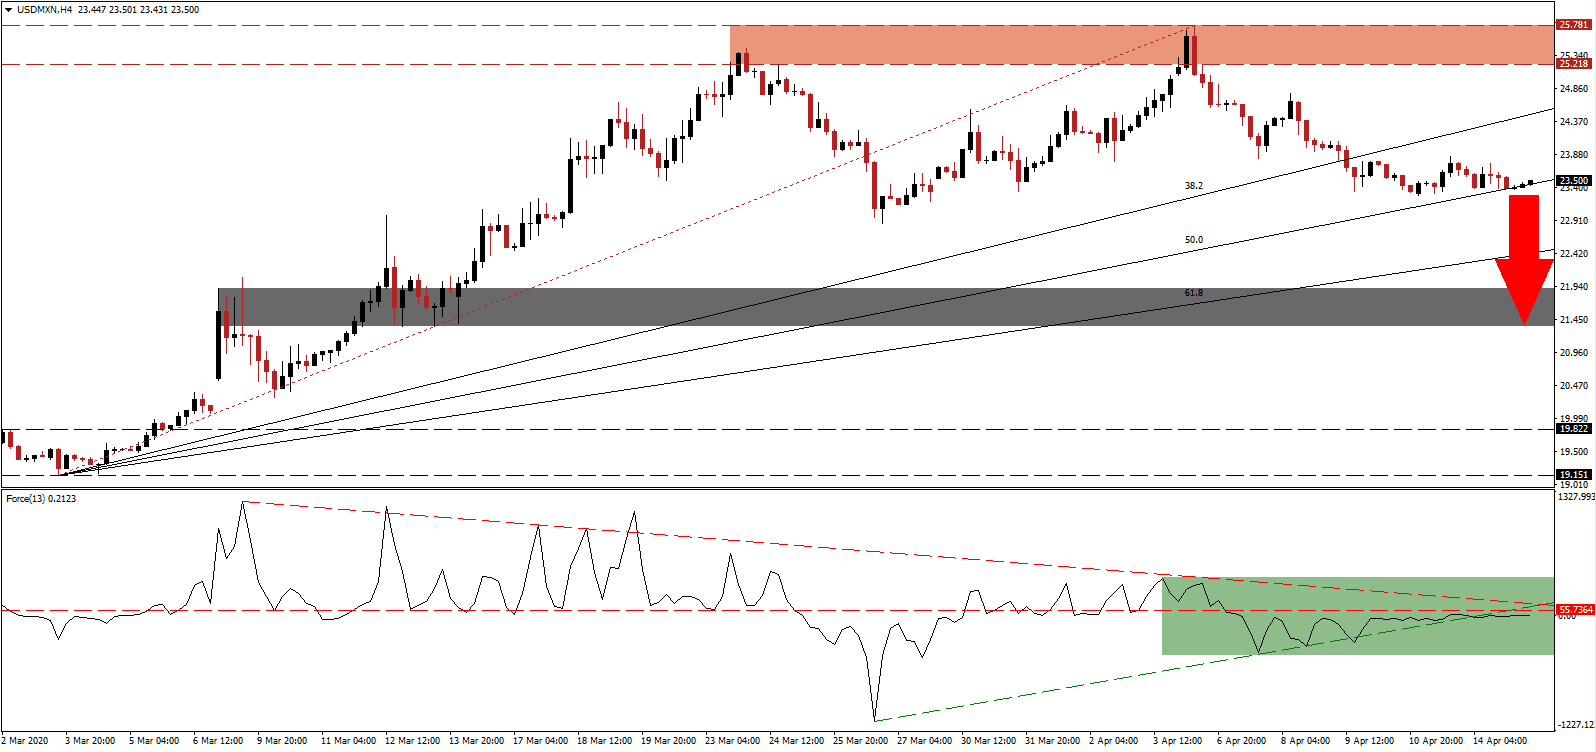
The Force Index, a next-generation technical indicator, confirms dominant bearish momentum following the contraction below its ascending support level, as marked by the green rectangle. More downside pressure is provided by its descending resistance level, which is expected to guide the Force Index farther below its horizontal resistance level. A collapse in this technical indicator below the 0 center-line will cede control of the USD/MXN to bears.
This currency pair reached an essential support level, provided by its ascending 50.0 Fibonacci Retracement Fan. After the breakdown in the USD/MXN below its resistance zone located between 25.218 and 25.781, as marked by the red rectangle, a bearish chart pattern materialized. Mexico was forced to agree to steeper oil production cuts in an unprecedented move by OPEC+ to reduce supply by 9.7 million barrels per day until the end of May. While the country faces a magnitude of economic worries, they are trumped by US problems, creating a long-term bearish bias in price action.
Forex traders are advised to monitor the intra-day low of 22.874, the previous base of a breakdown sequence, which was reversed into a marginally higher high. A move below this level is likely to attract the next wave of net sell orders, initiating a new breakdown sequence in the USD/MXN. The short-term support zone awaits price action between 21.349 and 21.906, as identified by the grey rectangle. A contraction into its long-term support zone between 19.151 and 19.822 is possible, given the mounting US debt load.
USD/MXN Technical Trading Set-Up - Breakdown Extension Scenario
- Short Entry @ 23.500
- Take Profit @ 21.350
- Stop Loss @ 24.100
- Downside Potential: 21,500 pips
- Upside Risk: 6,000 pips
- Risk/Reward Ratio: 3.58
In the event of a sustained breakout in the Force Index above its ascending support level, acting as resistance, the USD/MXN is expected to spike higher. Any recovery off of the 50.0 Fibonacci Retracement Support Level is limited to the top range of its resistance zone. Forex traders are recommended to view this as a selling opportunity on the back of underestimated long-term negative impacts of the global Covid-19 pandemic on the US economy.
USD/MXN Technical Trading Set-Up - Limited Reversal Scenario
- Long Entry @ 24.500
- Take Profit @ 25.350
- Stop Loss @ 24.100
- Upside Potential: 8,500 pips
- Downside Risk: 4,000 pips
- Risk/Reward Ratio: 2.13
