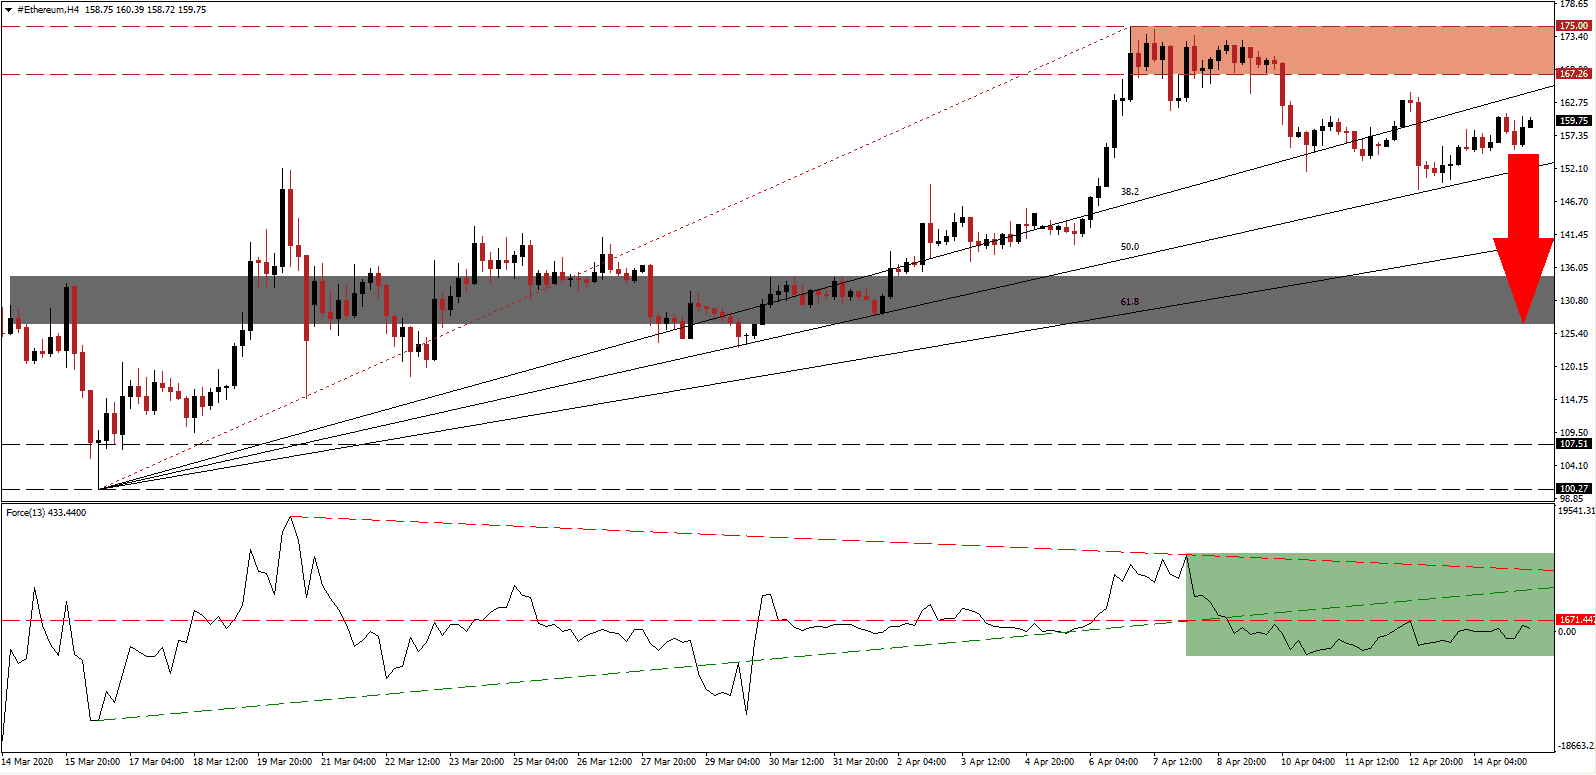
Cryptocurrencies recovered significantly following the first wave of institutional selling in response to the sell-off in global equity markets. As a bear market rally eliminated downside pressures, the second wave of selling is likely to challenge the March lows. The profitability of miners faded with price action, and while the ETH/USD recovered by 96.61% from its March intra-day low of 89.01, it faces significant fundamental challenges. A collapse into its short-term support zone is anticipated to follow, from where more downside cannot be excluded. The global Covid-19 pandemic will force structural changes, and this sector will not be immune to the transition.


The Force Index, a next-generation technical indicator, suggests a new breakdown sequence is pending. After the contraction below its ascending support level followed by a conversion of its horizontal support level into resistance, as marked by the green rectangle, bearish pressures expanded. Limiting the recovery potential is the descending resistance level, and this technical indicator is positioned to accelerate into negative territory. It will allow bears to regain control of the ETH/USD, initiating an extension of the long-term correction.
Following the breakdown in this cryptocurrency pair below its resistance zone located between 167.26 and 175.00, as identified by the red rectangle, bullish momentum deflated. While price action was able to bounce higher off of its ascending 50.0 Fibonacci Retracement Fan Support Level, the marquee Bitmain Antminer E3 will soon become obsolete. It is unable to process the increasing volume of the essential DAG file. It will force a severe contraction in the hashrate, making the network vulnerable to attacks. Bitmain announced a firmware upgrade to extend the shelf-life to October, but costly upgrades may ultimately be required. Uncertainty over future investments in the ETH/USD infrastructure grants a bearish fundamental bias.
Adding to bearish developments is the formation of a series of lower highs and lower lows, favored to provide sufficient breakdown pressure to force a collapse in price action. The ETH/USD is well-positioned to correct into its short-term support zone located between 126.71 and 134.53, as marked by the grey rectangle. More downside is possible, with the next support zone in the ETH/USD located between 100.27 and 107.51. You can learn more about a breakdown here.
ETH/USD Technical Trading Set-Up - Breakdown Scenario
- Short Entry @ 159.75
- Take Profit @ 126.70
- Stop Loss @ 167.75
- Downside Potential: 3,305 pips
- Upside Risk: 800 pips
- Risk/Reward Ratio: 4.13
Should the Force Index accelerate above its descending resistance level, the ETH/USD is expected to attempt a breakout. With bearish fundamental developments expanding, the upside remains limited to its next resistance zone located between 196.34 and 209.85. The 200 level represents a critical psychological resistance level, and traders are advised to consider any push higher as an outstanding selling opportunity.
ETH/USD Technical Trading Set-Up - Limited Breakout Scenario
- Long Entry @ 182.00
- Take Profit @ 202.00
- Stop Loss @ 175.00
- Upside Potential: 2,000 pips
- Downside Risk: 700 pips
- Risk/Reward Ratio: 2.86
