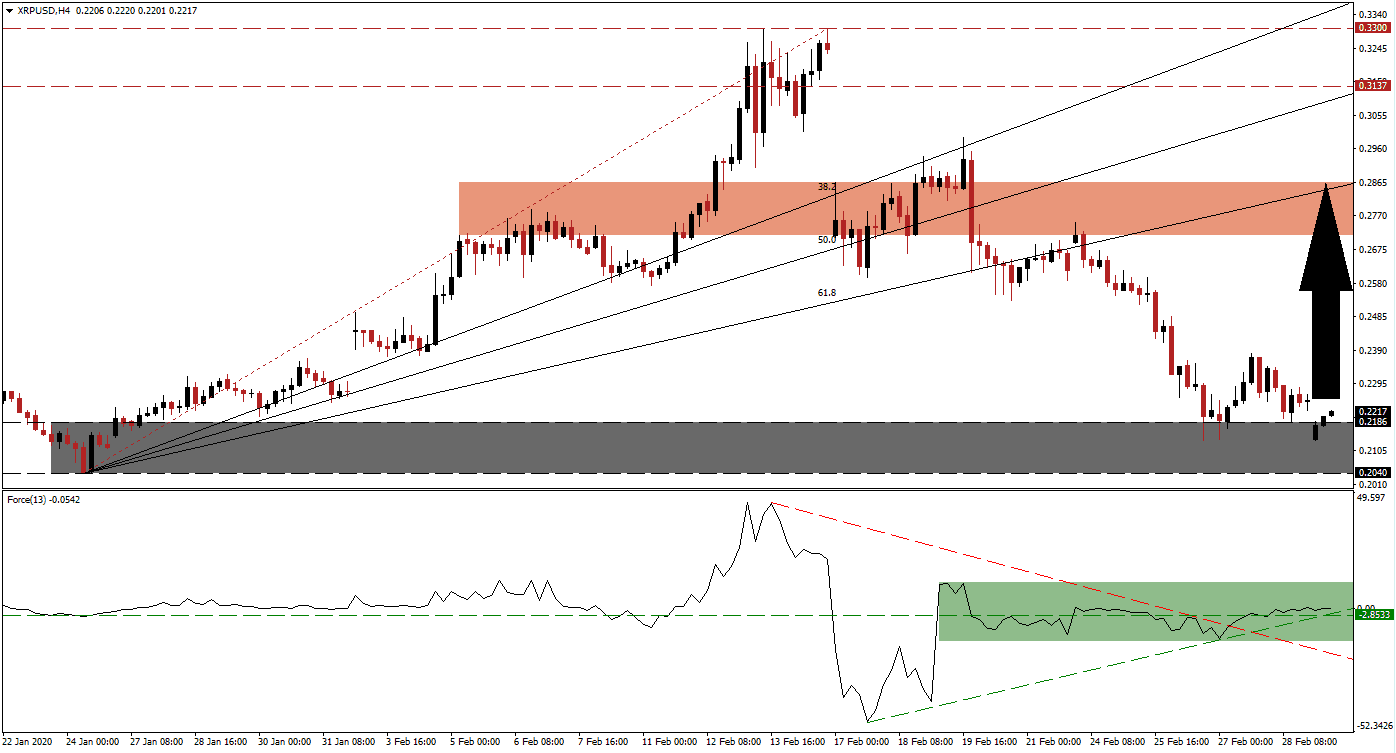
Covid-19 related panic selling last week swept across the entire global financial system, cryptocurrencies included. It provided more evidence that this emerging asset class is correlated to other assets, primarily due to the inflow of institutional capital into the sector. Adding to short-term downside pressure is the release of one billion Ripple tokens from escrow by the Ripple Foundation, worth roughly $230 million. The frequent dumping of one billion tokens has angered a continuously growing number of traders. Despite the dump, the XRP/USD pushed out of its support zone from where a short-covering rally is anticipated.
The Force Index, a next-generation technical indicator, displays the presence of a positive divergence. While this digital asset extended its corrective phase, the Force Index advanced. A brief contraction below its horizontal support level was reversed off of its ascending support level. The breakout above its descending resistance level added to bullish pressures. This technical indicator is favored to cross above the 0 center-line, granting bulls to take control of the XRP/USD. You can learn more about the Force Index here.
Following the breakout in this digital asset above its support zone located between 0.2040 and 0.2186, as marked by the grey rectangle, a short-covering rally is likely to close the gap to its ascending 61.8 Fibonacci Retracement Fan Support Level. Adding a fundamental boost to the XRP/USD is the possibility to broaden the ledger-capability to allow the creation of stablecoins and other assets pegged to external value. Volatility is expected to remain elevated, as evident in the flash crash on BitMEX to 0.1500 two weeks ago.
One key level to monitor is the intra-day high of 0.2382, the peak of a failed breakout attempt. A sustained move above this level should inspire the next wave of buying in the XR/USD. It will additionally clear the path for price action to accelerate into its next short-term resistance zone located between 0.2715 and 0.2865, as marked by the red rectangle. The 61.8 Fibonacci Retracement Fan Support Level is on the verge of pushing out of it, suggesting more upside is possible. You can learn more about a breakout here.
XRP/USD Technical Trading Set-Up - Short-Covering Scenario
Long Entry @ 0.2220
Take Profit @ 0.2865
Stop Loss @ 0.2020
Upside Potential: 645 pips
Downside Risk: 200 pips
Risk/Reward Ratio: 3.23
Should the Force Index complete a breakdown below its descending resistance level, which currently acts as support, the XRP/USD is likely to be pressured into a breakdown. This may jeopardize the psychological support level of 0.2000. While caution is recommended, the long-term outlook for this digital asset remains bullish. The next support zone is located between 0.1658 and 0.1742, representing a great buying opportunity.
XRP/USD Technical Trading Set-Up - Limited Breakdown Scenario
Short Entry @ 0.1980
Take Profit @ 0.1740
Stop Loss @ 0.2100
Downside Potential: 240 pips
Upside Risk: 120 pips
Risk/Reward Ratio: 2.00

