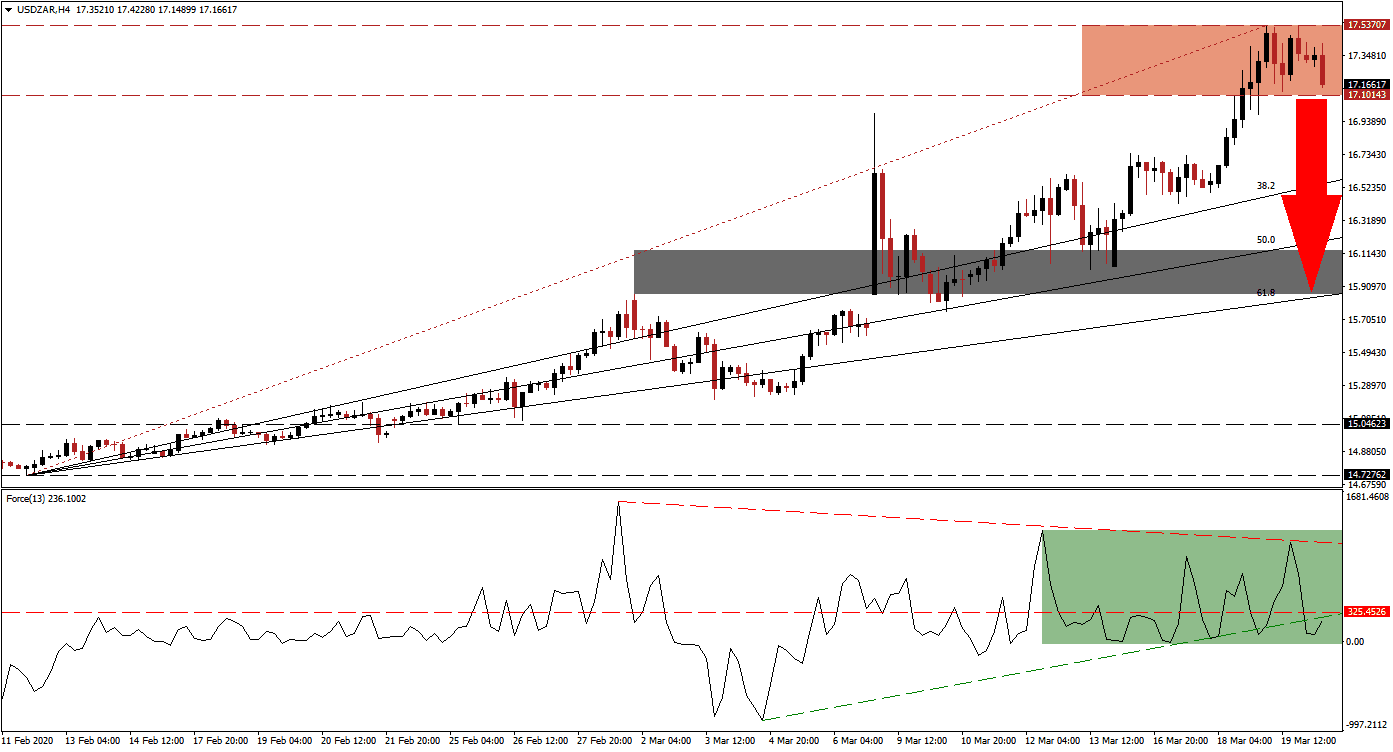
Joining the chorus of interest rate actions, the South African Reserve Bank reduced interest rates to 5.25%, down 100 basis points. It was the most significant reduction in over a decade by the central bank, and it lowered its 2020 forecast to reflect a 0.2% annualized contraction, a revision from its previous call for an increase of 1.2%. The USD/ZAR retreated from the highest level since January 2016 while remaining inside of its resistance zone. Breakdown pressures are on the rise, and a profit-taking sell-off is pending, amid exhausted upside in this currency pair.
The Force Index, a next-generation technical indicator, confirms weakening bullish pressures, and a negative divergence offers an early warning that a corrective phase is on the horizon. While the USD/ZAR pushed to multi-year highs, the Force Index created a series of lower highs. It converted its horizontal support level into resistance and dropped below its ascending support level, as marked by the green rectangle. This technical indicator is favored to cross below the 0 center-line, ceding control of this currency pair to bears. You can learn more about the Force Index here.
Borrowing costs have started to rise in the US, despite the Federal Reserve plunging its interest rate to 0.00%, restarting quantitative easing, and pumping over $1 trillion into the financial system. The costs and long-term damage created by the central bank are being priced into the US Treasury market, limiting the hoped-for positive response. A breakdown in the USD/ZAR below its resistance zone located between 17.10143 and 17.53707, as marked by the red rectangle, is anticipated.
One of the most ignored ripple effects of Covid-19 is pending job losses across the US economy. Yesterday’s initial jobless claims and regional manufacturing reports provided economic data, expected to weaken moving forward. A profit-taking sell-off will allow this currency pair to close the gap to its ascending 38.2 Fibonacci Retracement Fan Support Level. It will also add downside momentum to pressure the USD/ZAR into its short-term support zone located between 15.85700 and 16.13341, as marked by the grey rectangle, enforced by its 61.8 Fibonacci Retracement Fan Support Level.
USD/ZAR Technical Trading Set-Up - Profit-Taking Scenario
Short Entry @ 17.16500
Take Profit @ 15.90000
Stop Loss @ 17.55000
Downside Potential: 12,650 pips
Upside Risk: 3,850 pips
Risk/Reward Ratio: 3.29
In the event of an acceleration in the Force Index above its descending resistance level, the USD/ZAR is expected to push higher. With this currency pair near all-time highs and a deteriorating fundamental outlook, the upside potential remains severely reduced. The next resistance zone is located between 17.84990 and 17.96622. Forex traders are advised to be cautious, but a breakout is unlikely without a significant change in existing conditions.
USD/ZAR Technical Trading Set-Up - Limited Breakout Scenario
Long Entry @ 17.66500
Take Profit @ 17.96500
Stop Loss @ 17.51500
Upside Potential: 3,000 pips
Downside Risk: 1,500 pips
Risk/Reward Ratio: 2.00

