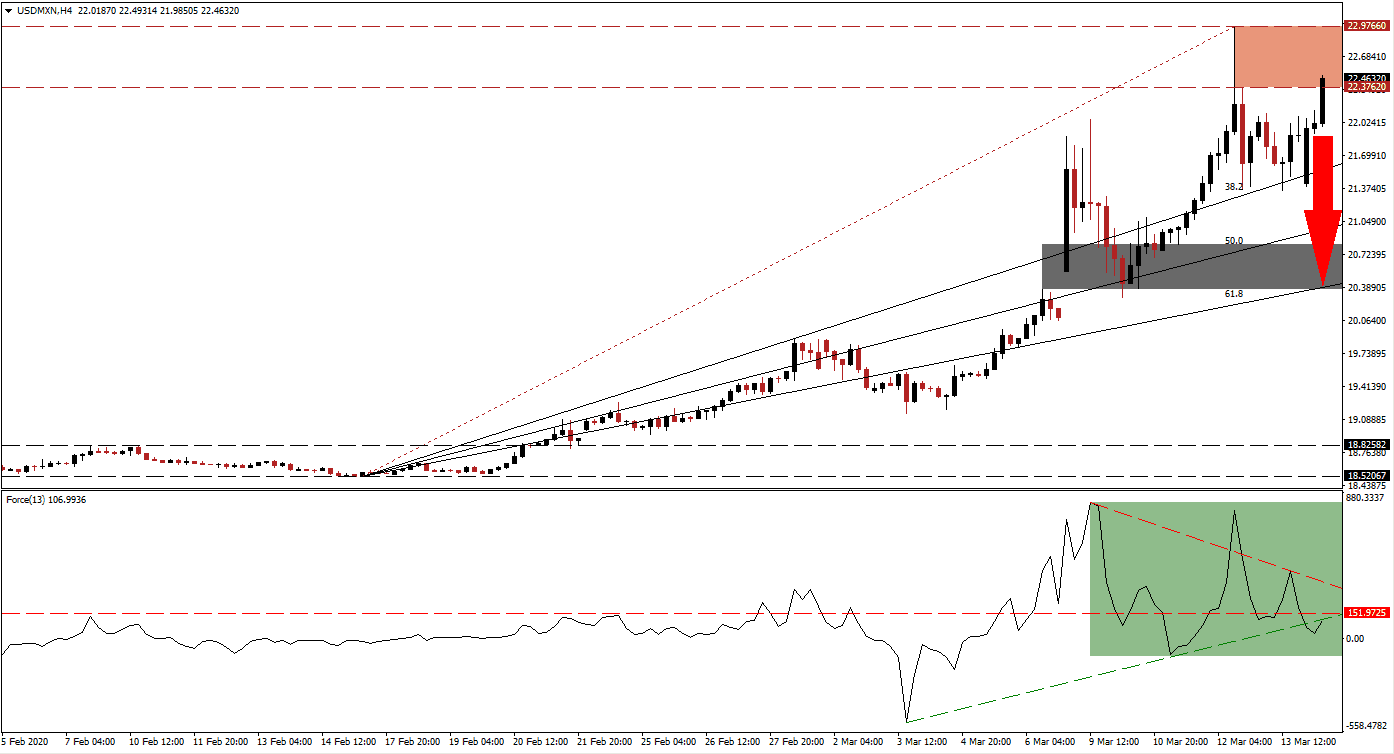
Despite the US Federal Reserve action last night, slashing interest rates to 0.00% and boosting quantitative easing, the USD/MXN was pressured higher. The US Dollar benefited from a rush to liquid assets after the US central bank announced $1.5 trillion of liquidity last week before yesterday’s attempt to surprise markets. Due to Covid-19, Mexico is now likely to face severe recessionary risks. Policies of Mexican President Andres Manuel Lopez Obrador already depressed investment flows, but finance minister Arturo Herrera tried to assure markets the economy is well-shielded from the global fallout. The exhausted upside in this currency pair is vulnerable to a correction following the current breakdown.
The Force Index, a next-generation technical indicator, provides an early warning that a more massive reversal is imminent. After the USD/MXN pushed to a fresh 2020 high, a negative divergence materialized as the Force Index contracted. It resulted in the conversion of its horizontal support level into resistance, as marked by the green rectangle, and a push below its ascending support level. This technical indicator is now favored to extend its reversal into negative territory, enforced by its descending resistance level, and allow bears to take control of price action. You can learn more about the Force Index here.
After the initial breakdown in this currency pair below its resistance zone located between 22.37620 and 22.97660, as marked by the red rectangle, the ascending 38.2 Fibonacci Retracement Fan Support Level pushed the USD/MXN back inside of it. The move was assisted by the US Dollar liquidity rush, but the risk to the US economy is trumping the short-term positive impact. 78% of Mexican debt is priced in its domestic currency, and 81% carries fixed interest rates, protecting public sector finances. The Mexican government has access to $70 billion in emergency financing if necessary.
Breakdown risks are on the rise with a profit-taking sell-off pending a renewed contraction in the USD/MXN below its resistance zone. One essential level to monitor is the intra-day low of 21.39709, the low before the most recent reversal. A push through this level is expected to result in the net addition of sell orders, providing the required catalyst to the downside. This currency pair is anticipated to challenge its short-term support zone located between 20.37719 and 20.81879, as marked by the grey rectangle, enforced by its 61.8 Fibonacci Retracement Fan Support Level.
USD/MXN Technical Trading Set-Up - Profit-Taking Scenario
Short Entry @ 22.46250
Take Profit @ 20.41250
Stop Loss @ 23.00000
Downside Potential: 25,000 pips
Upside Risk: 5,375 pips
Risk/Reward Ratio: 4.65
In the event of a sustained breakout in the Force Index above its descending resistance level, the USD/MXN is expected to push through its resistance zone. An increase in volatility is favored to persist as Forex traders react to central bank decisions. The outlook for this currency pair, coming off of all-time highs following the collapse in oil prices, remains uncertain. A potential resistance zone is located between 23.57790 and 24.05290.
USD/MXN Technical Trading Set-Up - Breakout Scenario
Long Entry @ 23.10000
Take Profit @ 23.75000
Stop Loss @ 22.85000
Upside Potential: 6,500 pips
Downside Risk: 2,500 pips
Risk/Reward Ratio: 2.60

