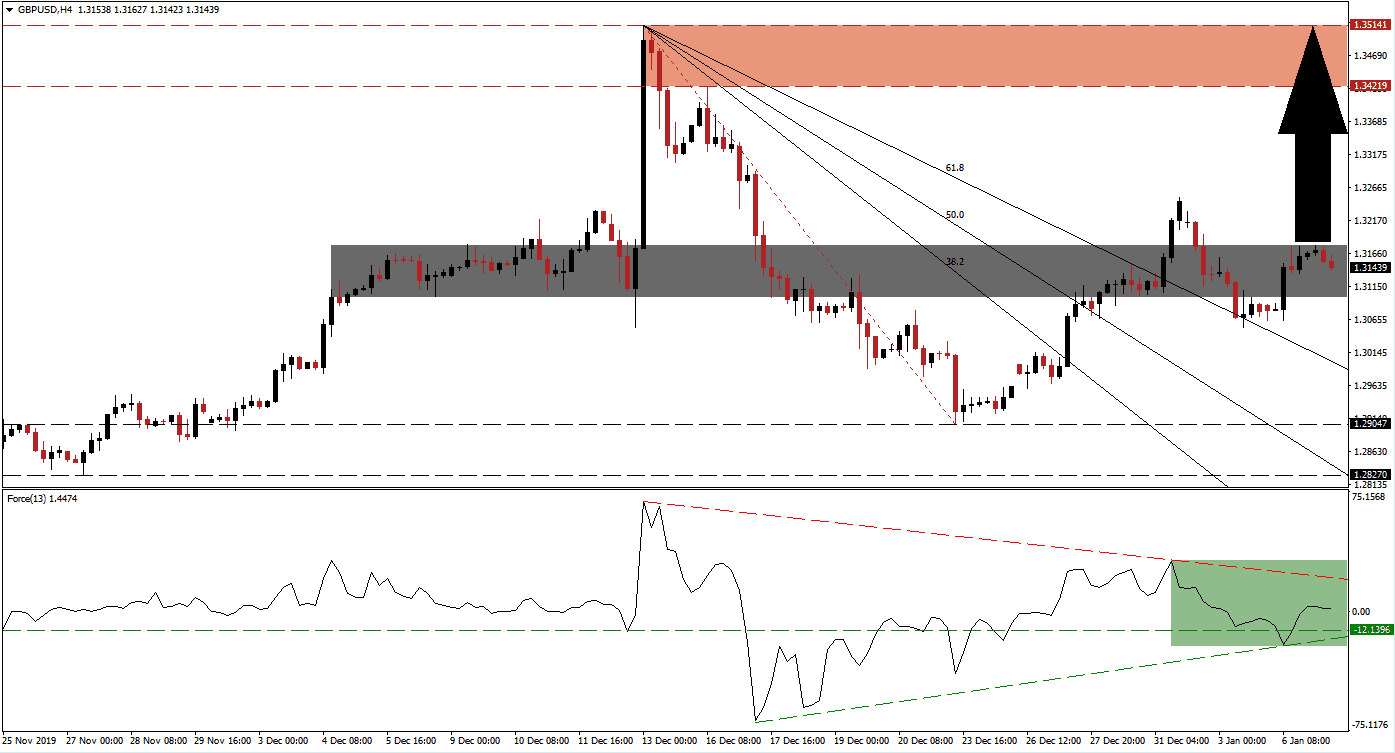
Brexit will be on traders’ minds with the return of the UK Parliament from its winter recess. Prime Minister Johnson will deliver the thrice-delayed Brexit on January 31st 2020, but the persisting issue remains the transition period. The UK will remain under EU rules and regulations until December 31st 2020, and the EU warned that it is not enough time to negotiate a trade deal. Despite the slim chances of a no-deal Brexit, the GBP/USD formed a long-term bullish chart pattern. It materialized after price action created a high lower at the top range of its support zone, leading to a reversal in this currency pair.
The Force Index, a next-generation technical indicator, shows the increase in volatility with a bullish bias. Following a series of higher lows, an ascending support level emerged, providing a solid floor under reversal. The Force Index was briefly pressured below its horizontal support level by its descending resistance level. This technical indicator quickly recovered, as marked by the green rectangle, and moved into positive conditions. Bulls remain in control of price action, and the GBP/USD is anticipated to move farther to the upside. You can learn more about the Force Index here.
Adding to long-term bullish developments was the conversion of its short-term resistance zone into support. This zone is located between 1.30991 and 1.31778, as marked by the grey rectangle. The initial breakout above it was followed by a breakdown before the descending 61.8 Fibonacci Retracement Fan Support Level forced a reversal back into it. Following the volatile price action moves, the conversion was confirmed, and the GBP/USD is favored to extend its advance. You can learn more about the Fibonacci Retracement Fan here.
Forex traders are advised to monitor the intra-day high of 1.32510, the peak of the initial breakout above its short-term support zone. A move above this level is expected to result in the addition of new net long positions. Today’s US economic data may provide the next fundamental catalyst for this currency pair, especially if it follows the series of disappointments since December. This should take the GBP/USD back into its resistance zone located between 1.34219 and 1.35141, as marked by the red rectangle. More upside is possible unless existing fundamental conditions change.
GBP/USD Technical Trading Set-Up - Breakout Scenario
Long Entry @ 1.31450
Take Profit @ 1.35150
Stop Loss @ 1.30500
Upside Potential: 400 pips
Downside Risk: 95 pips
Risk/Reward Ratio: 4.21
In case of a sustained breakdown in the Force Index below its ascending support level, the GBP/USD may be pressured below its short-term support zone. Due to the long-term bullish fundamental outlook, supported by technical developments, any breakdown is anticipated to end near its long-term support zone. Price action will face this zone between 1.28270 and 1.29047. Forex traders are recommended to view this as an outstanding buying opportunity.
GBP/USD Technical Trading Set-Up - Limited Breakdown Scenario
Short Entry @ 1.29900
Take Profit @ 1.29000
Stop Loss @ 1.30300
Downside Potential: 90 pips
Upside Risk: 40 pips
Risk/Reward Ratio: 2.25

