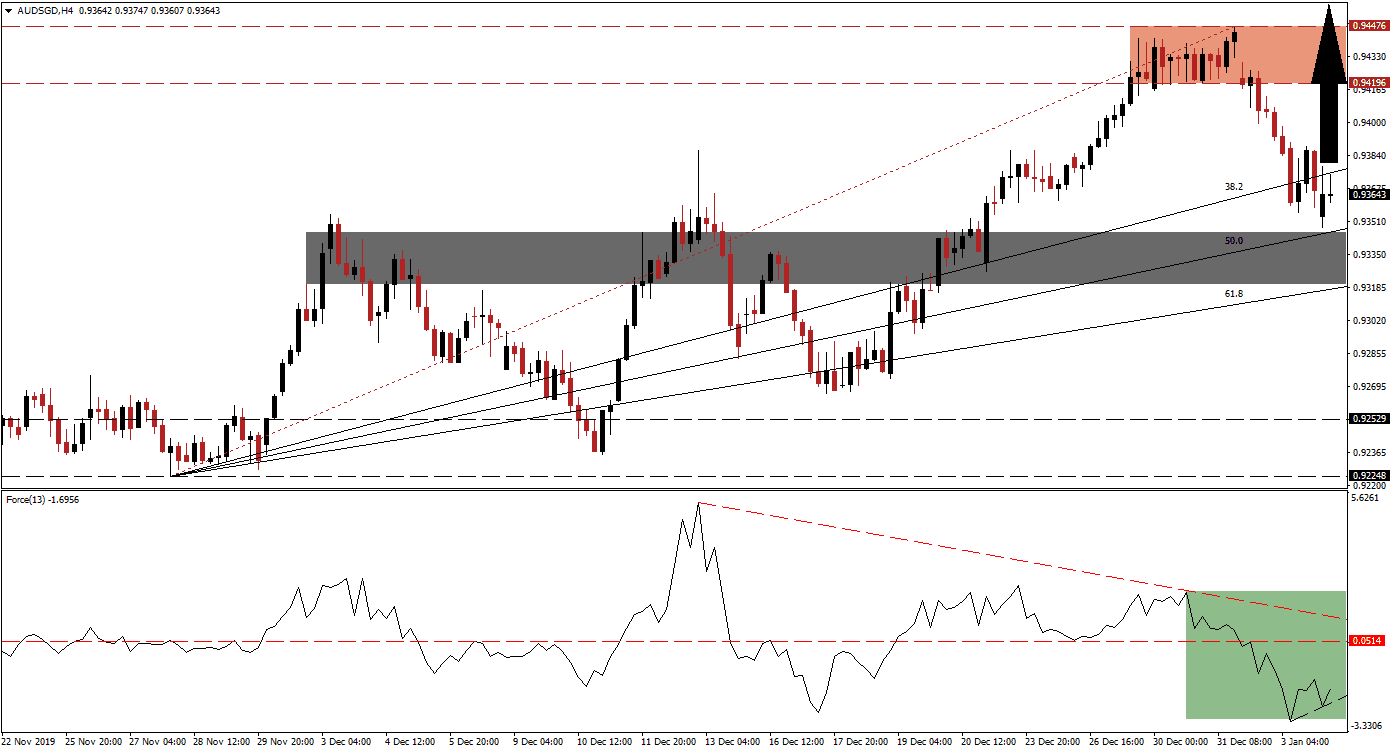
Hong Kong protests continue, but fatigue has set in. The harm to the local economy appears to be easing, as evident by the latest PMI reports. While the contraction is ongoing, the pace has eased despite the global economic slowdown. Capital outflows from Hong Kong, which directly benefited Singapore, have peaked. The Singapore Dollar is now exposed to economic data painting a weak picture. Following a period of profit-taking in the AUD/SGD, bearish momentum has eased, and the long-term uptrend remains intact. After price action reached its ascending 50.0 Fibonacci Retracement Fan Support Level, the sell-off ended.
The Force Index, a next-generation technical indicator, descended to a fresh low as a result of the corrective phase. Bullish momentum started to recover, and a minor positive divergence materialized, as marked by the green rectangle. The Force Index is expected to advance and convert its horizontal resistance zone back into support. This will place it into positive territory with bulls in charge of the AUD/SGD. This technical indicator will face its descending resistance level, from where a breakout is required to push this currency pair higher. You can learn more about the Force Index here.
Bearish momentum faded after price action approached the top range of its short-term support zone located between 0.93198 and 0.93458, as marked by the grey rectangle. The 61.8 Fibonacci Retracement Fan Support Level is enforcing this zone and maintaining the bullish trend in the AUD/SGD. The Chinese service sector cooled its expansion in December, while the Australian manufacturing sector extended its contraction. Following the price spike across the commodity sector after the US killed a top Iranian general in Iraq, the Australian Dollar is anticipated to strengthen. You can learn more about a support zone here.
A breakout by the AUD/SGD above its 38.2 Fibonacci Retracement Fan Resistance Level will turn it back into support and initiate a short-covering rally. This should take price action back into its resistance zone located between 0.94196 and 0.94476, as marked by the red rectangle. The Australian Dollar is a commodity currency, and if elevated prices remain as a result of the increase in tensions across the Middle East, stirred by the US attack last week, a breakout in this currency pair is possible. The next resistance zone awaits price action between 0.95133 and 0.95407.
AUD/SGD Technical Trading Set-Up - Price Action Recovery Scenario
Long Entry @ 0.93650
Take Profit @ 0.94450
Stop Loss @ 0.93150
Upside Potential: 160 pips
Downside Risk: 50 pips
Risk/Reward Ratio: 3.20
In case of a breakdown in the Force Index below its ascending support level, the AUD/SGD may attempt to push to the downside. Given the dominant fundamental scenario, the downside potential is limited to its next long-term support zone between 0.92248 and 0.92529. The developing technical picture points towards a recovery in this currency pair, and any potential sell-off from current levels should be viewed as a good buying opportunity.
AUD/SGD Technical Trading Set-Up - Limited Breakdown Scenario
Short Entry @ 0.92950
Take Profit @ 0.92350
Stop Loss @ 0.93200
Downside Potential: 60 pips
Upside Risk: 25 pips
Risk/Reward Ratio: 2.40

