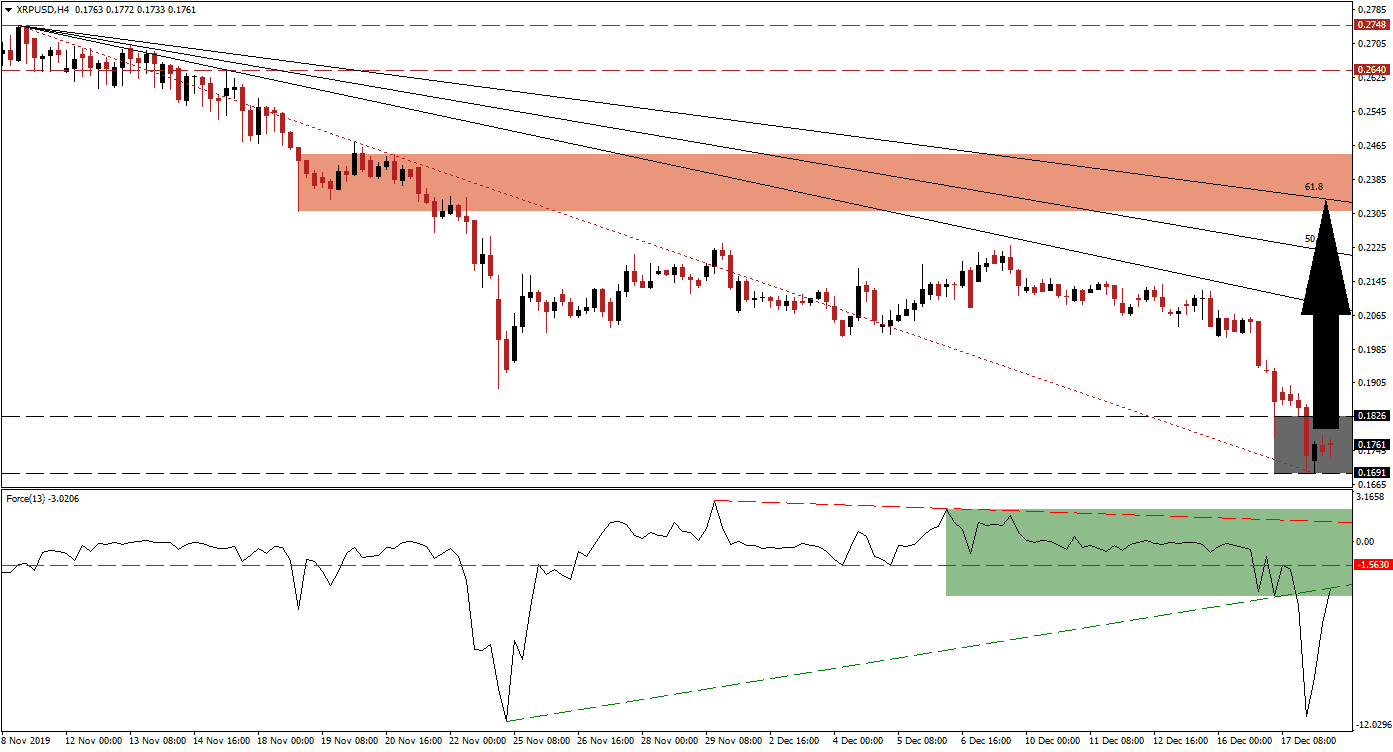
Memories from the Crypto Winter of 2018 are resurfacing as Bitcoin is leading the majority of the cryptocurrency market to the downside, erasing billions of value weekly. While the XRP/USD has been caught in the vortex and recorded a fresh 52-week low, the fundamental outlook continues to improve. Unlike many smaller projects who are reducing their workforce, Ripple is expanding and now employs over 530 individuals globally. The expansion is expected to continue in 2020, and price action remains extremely disconnected from fundamentals. This cryptocurrency pair is now stabilizing inside of its support zone.
The Force Index, a next-generation technical indicator, plunged together with the XRP/USD before sharply reversing. The low of the bearish contraction resulted in a marginally higher low, as compared to its previous one; this resulted in a bullish development. The Force Index is now approaching its ascending support level, which temporarily acts as resistance after the breakdown, and a breakout is favored to follow. This technical indicator is expected to push through its horizontal resistance level and back into positive conditions, placing bulls in charge of this cryptocurrency pair.
Price action halted its corrective phase, and while downside risks remain, the long-term fundamental outlook enjoys an increased bullish bias for 2020. The support zone located between 0.1691 and 0.1826, as marked by the grey rectangle, is anticipated to allow for a short-covering rally to emerge. This is expected to close the gap between the XRP/USD and its descending 38.2 Fibonacci Retracement Fan Resistance Level. Forex traders are advised to monitor the intra-day low of 0.1892, the previous low of the sell-off before a drift higher; a breakout above this level is likely to result in the addition of new net long positions. You can learn more about the Fibonacci Retracement Fan here.
A breakout in the XRP/USD above its 38.2 Fibonacci Retracement Fan Resistance Level, converting it back to support, is expected to extend the upside potential into its short-term resistance zone. This zone awaits price action between 0.2308 and 0.2471, as marked by the red rectangle; the 61.8 Fibonacci Retracement Fan Resistance Level is passing through this zone and poses a significant resistance for this cryptocurrency pair. A move higher would invalidate the downtrend, and clear the path for more upside; the next long-term resistance zone is located between 0.2640 and 0.2748.
XRP/USD Technical Trading Set-Up - Breakout Scenario
Long Entry @ 0.1750
Take Profit @ 0.2325
Stop Loss @ 0.1600
Upside Potential: 575 pips
Downside Risk: 150 pips
Risk/Reward Ratio: 3.83
In case of a reversal in the Force Index, breakdown risks for the XRP/USD will increase. Given the extent of the sell-off to fundamental developments, the downside remains extremely limited. This cryptocurrency pair will reach its next support zone between 0.1270 and 0.1481 from where more downside would require a major catalyst. Spreading buy orders between both support zones remains the recommended approach.
XRP/USD Technical Trading Set-Up - Unlikely Breakdown Scenario
Short Entry @ 0.1550
Take Profit @ 0.1350
Stop Loss @ 0.1650
Downside Potential: 200 pips
Upside Risk: 100 pips
Risk/Reward Ratio: 2.00

