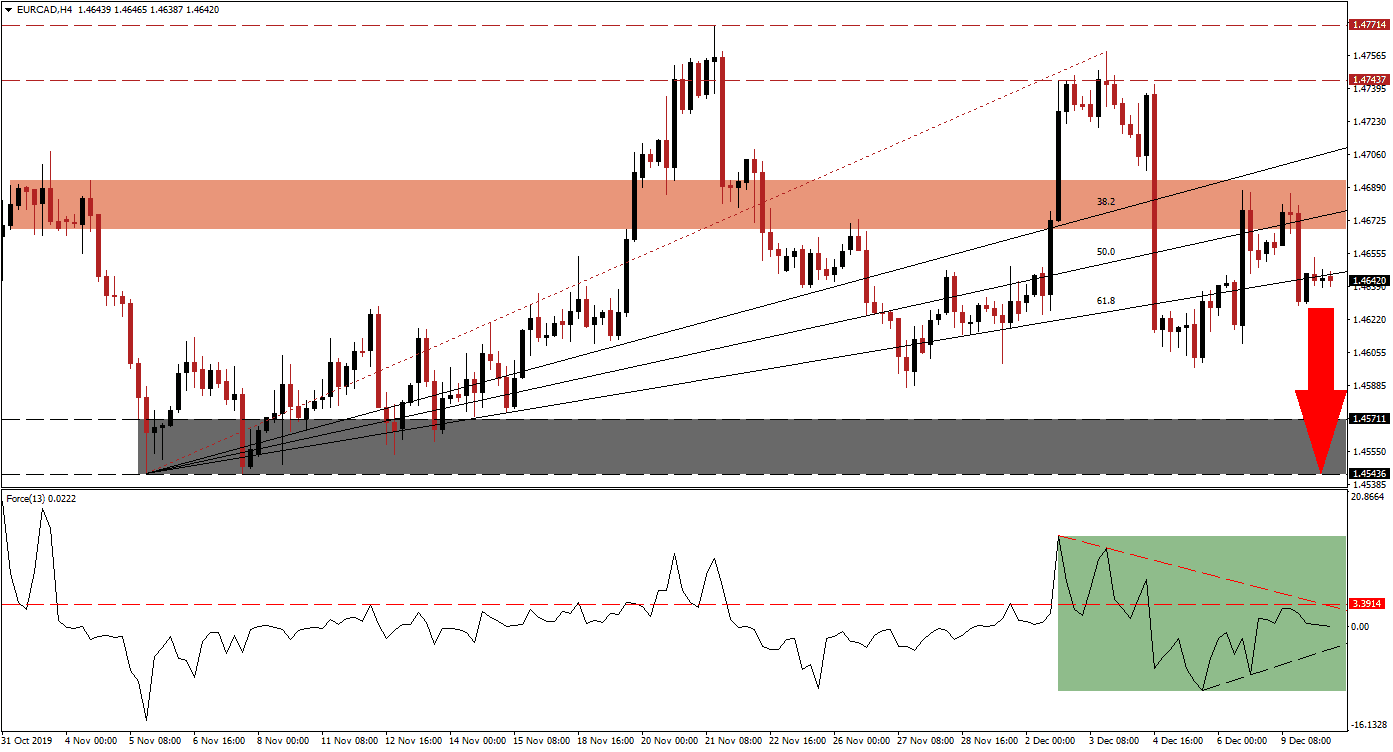
Following the breakdown in the EUR/CAD below its short-term resistance zone, more downside is anticipated to follow. The Eurozone economy remains weaker than economists expected, especially in Germany. The ECB is pleading with governments to increase fiscal spending; this is ruled out by the German finance ministry as it states a recovery is imminent, and government spending is not required to stimulate the economy. An extension of the breakdown is favored, and today’s ZEW data may provide a short-term fundamental catalyst. You can learn more about a breakdown here.
The Force Index, a next-generation technical indicator, points towards the gradual erosion of bullish momentum after this currency pair started its descend from its long-term resistance zone, resulting in a breakdown sequence. The Force Index converted its horizontal support level into resistance but was able to reverse, after reaching its ascending support level. This technical indicator was rejected by its horizontal resistance level, as marked by the green rectangle, and its descending resistance level crossed below it. The Force Index is now anticipated to contact into negative territory, and place bears firmly in charge of the EUR/CAD.
As a result of the lower high in this currency pair, recorded inside its long-term resistance zone located between 1.47437 and 1.47714, the Fibonacci Retracement Fan sequence was redrawn. The ascending 50.0 Fibonacci Retracement Fan Resistance Level has now entered its short-term resistance zone, located between 1.46681 and 1.46930, as marked by the red rectangle. The EUR/CAD may temporarily advance into the bottom range of its short-term resistance zone, but a resumption of the downtrend is expected to follow. You can learn more about the Fibonacci Retracement Fan here.
Economic data out of Canada has disappointed over the past few trading sessions, but given the state of the Eurozone economy, a higher Canadian Dollar against the Euro is anticipated. Forex traders are advised to monitor the intra-day low of 1.46290 which marks the low of the most recent move below its 61.8 Fibonacci Retracement Fan Resistance Level, a descend below this mark is favored to initiate the next round of sell orders. The EUR/CAD will then have a clear path into its support zone, located between 1.45436 and 1.45711, as marked by the grey rectangle.
EUR/CAD Technical Trading Set-Up - Breakdown Extension Scenario
Short Entry @ 1.46450
Take Profit @ 1.45450
Stop Loss @ 1.46750
Downside Potential: 100 pips
Upside Risk: 30 pips
Risk/Reward Ratio: 3.33
In the event of a double breakout in the Force Index, elevating this technical indicator above its descending resistance level and converting its horizontal resistance level into support, a breakout attempt in the EUR/CAD is possible. The long-term fundamental outlook remains bearish, and the upside potential limited to its intra-day high of 1.47582, the end-point of its Fibonacci Retracement Fan sequence; this will represent a sound short-selling opportunity in this currency pair.
EUR/CAD Technical Trading Set-Up - Limited Breakout Scenario
Long Entry @ 1.47100
Take Profit @ 1.47550
Stop Loss @ 1.46900
Upside Potential: 45 pips
Downside Risk: 20 pips
Risk/Reward Ratio: 2.25

