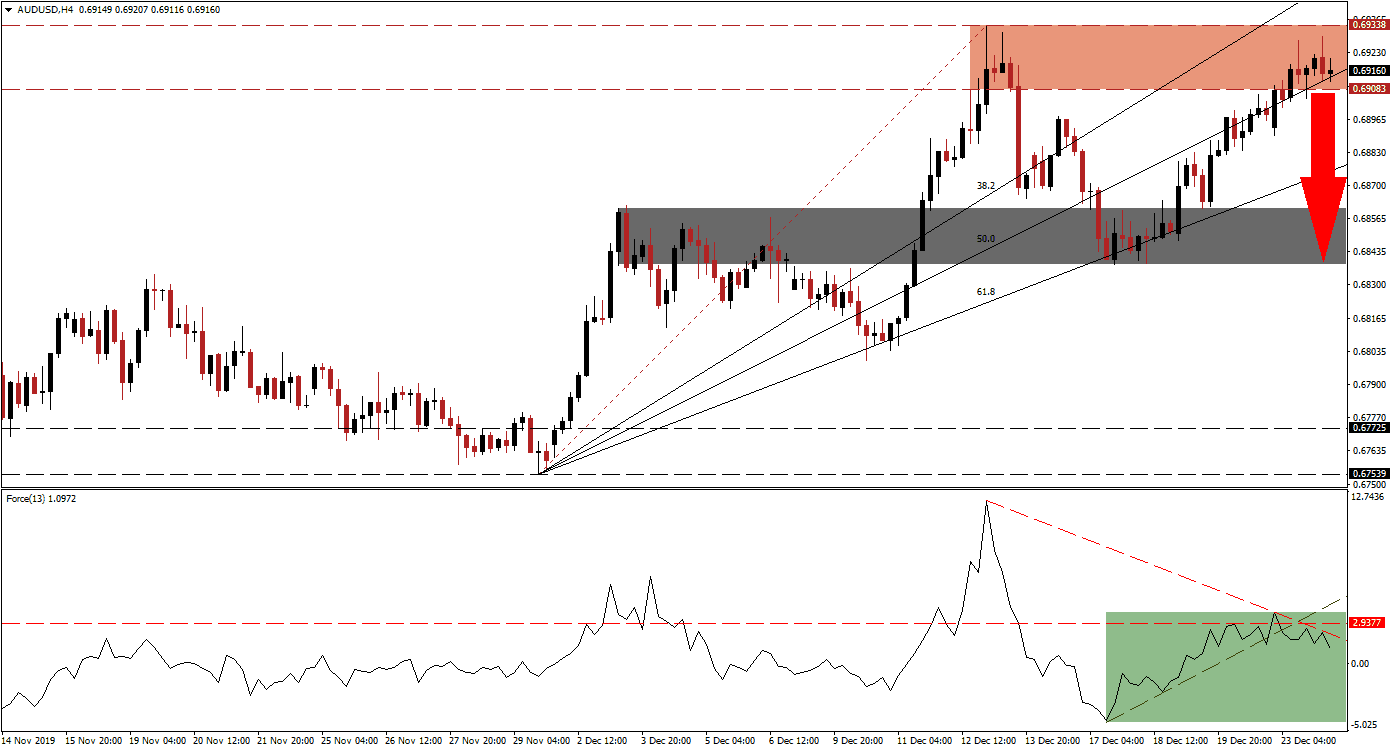
Thin trading volume due to the holiday-shortened trading week helped the AUD/USD ascend into its resistance zone. Bullish momentum started to recede and increased breakdown pressures for this currency pair. The Australian Dollar is the top Chinese Yuan proxy currency, and traders have accepted that that announced phase-one trade truce between the US and China is positive, at least for now. Year-end portfolio adjustments may be the biggest driving force for price action this week, and a short-term sell-off on the back of a profit-taking sell-off is anticipated.
The Force Index, a next-generation technical indicator, started to descend as this currency pair approached its resistance zone and a negative divergence formed. The Force Index has now moved below its horizontal support level, converting it into resistance, and additionally moved below its ascending support level. A descending resistance level materialized, adding downside pressure, as marked by the green rectangle. This technical indicator is now expected to move into negative territory, placing bears in control of the AUD/USD. You can learn more about the Force Index here.
A marginally lower high formed as price action moved into its resistance zone located between 0.69083 and 0.69338, marked by the red rectangle. A double top chart pattern formed, adding to short-term bearish developments. The ascending 50.0 Fibonacci Retracement Fan Support Level is crossing through the resistance zone, but the increase in bearish pressures is favored to lead to a double breakdown in the AUD/USD. Forex traders are advised to monitor the intra-day low of 0.69049, the low of a failed double breakdown, which led to a reversal and lower high. A breakdown below this mark is likely to accelerate a short-term sell-off.
With the long-term fundamental outlook for this currency pair bullish, the pending sell-off is expected to constitute a short-term event. A reversal will ensure the longevity of the uptrend in the AUD/USD, which is expected to receive a solid boost from the Chinese economic rebound slated for 2020. Price action may descend into its next short-term support zone located between 0.68386 and 0.68608, as marked by the grey rectangle. More downside would require a fresh fundamental catalyst, which is unlikely given the current scenario. You can learn more about a support zone here.
AUD/USD Technical Trading Set-Up - Short-Term Breakdown Scenario
Short Entry @ 0.69150
Take Profit @ 0.68450
Stop Loss @ 0.69350
Downside Potential: 70 pips
Upside Risk: 20 pips
Risk/Reward Ratio: 3.50
In case of a breakout in the Force Index above its ascending support level, acting as temporary resistance, the AUD/USD is anticipated to resume its advance. This would be in-line with its long-term trend, but increase the possibility of a more violent short-term counter-trend correction at a later date. The next resistance zone awaits price action between 0.69960 and 0.70325.
AUD/USD Technical Trading Set-Up - Breakout Scenario
Long Entry @ 0.69500
Take Profit @ 0.70200
Stop Loss @ 0.69250
Upside Potential: 70 pips
Downside Risk: 25 pips
Risk/Reward Ratio: 2.80

