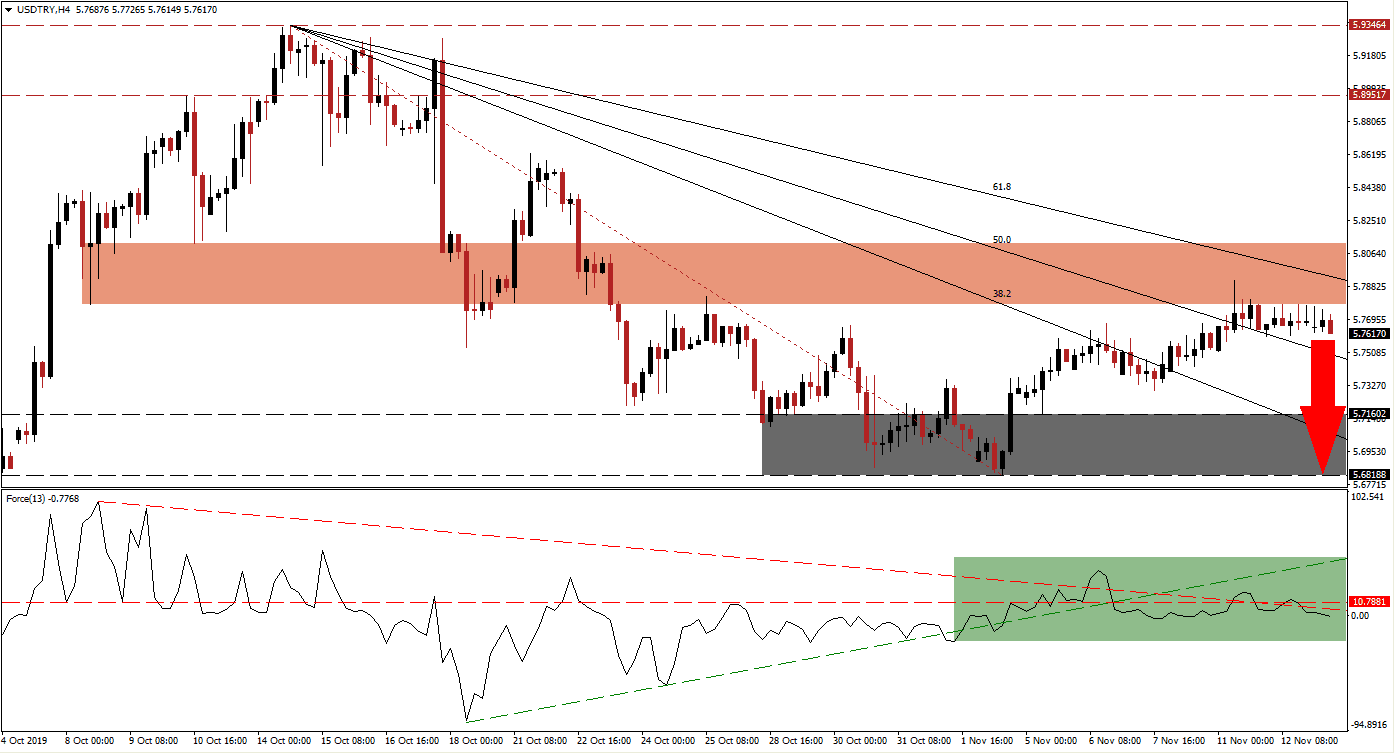
Uncertainty over the phase one trade truce between the US and China is growing as markets await more details. US President Trump stated he made no pledge to roll back tariffs which were in conflict with commentaries made by US officials involved in the trade talks and by the Chinese Ministry of Commerce. The lack of clarity on what was agreed suggests that it is less significant than what markets have priced in and the US Dollar remains under the risk of an extended move lower. The USD/TRY offered the latest sign of US Dollar weakness after its short-term resistance zone rejected an extension of the advance. You can read more about a resistance zone here.
The Force Index, a next-generation technical indicator, offered another red flag through the emergence of a negative divergence; a bearish trading signal which indicates that a directional change in price action should be expected. After the USD/TRY reached its short-term resistance zone, the Force Index completed a breakdown below its horizontal support level and converted it into resistance. The breakdown was extended below its descending resistance level and into negative territory as marked by the green rectangle and more downside in this currency pair is expected to follow with bears in charge of price action.
With the rise in bearish momentum following the rejection by its short-term resistance zone, located between 5.77802 and 5.81218 as marked by the red rectangle, a breakdown sequence below its 50.0 and 38.2 Fibonacci Retracement Fan Support Levels; the 61.8 Fibonacci Retracement Fan Resistance Level is crossing through the short-term resistance zone and adding downside pressure on the USD/TRY. With the Turkish economy more resilient than expected and bigger cracks in the US economy than priced in, this currency pair has more room to the downside. You can learn more about the Fibonacci Retracement Fan here.
One important level to monitor is the intra-day low of 5.72943 which represents the low of the previous reversal following a brief spike above the descending 38.2 Fibonacci Retracement Fan Resistance Level; a breakout followed and turned it into support. A move below this mark will end the uptrend and should take the USD/TRY back down into its support zone which is located between 5.68188 and 5.71602 as marked by the grey rectangle. Depending on the magnitude of the move to the downside, which may be assisted by a profit-taking sell-off, another breakdown could materialize.
USD/TRY Technical Trading Set-Up - Breakdown Extension Scenario
⦁ Short Entry @ 5.76000
⦁ Take Profit @ 5.68200
⦁ Stop Loss @ 5.78100
⦁ Downside Potential: 780 pips
⦁ Upside Risk: 210 pips
⦁ Risk/Reward Ratio: 3.71
In case of a double breakout in the Force Index, the USD/TRY could attempt to challenge its short-term resistance zone to the upside as this technical indicator attempts to close the increasing gap to its ascending support level which now acts as resistance. While the next long-term resistance zone awaits price action between 5.89517 and 5.93464, any breakout may be limited to the intra-day high of 5.86269 from where this currency pair previously accelerated to the downside.
USD/TRY Technical Trading Set-Up - Limited Breakout Scenario
⦁ Long Entry @ 5.82000
⦁ Take Profit @ 5.86200
⦁ Stop Loss @ 5.80000
⦁ Upside Potential: 420 pips
⦁ Downside Risk: 200 pips
⦁ Risk/Reward Ratio: 2.10

