Monthly economic indicators by the New Zealand Treasury were released during the Asian trading session and they painted a weak economic picture for the small, export oriented economy. The report noted that economic growth as well as business activity remained weaker than expected, but that inflation came in stronger than previously forecasted. It further noted that the 2019 GDP forecast is expected to fall short, but the New Zealand Dollar managed to keep its bullish stance against the Euro. This can be attributed to positive news flow out of the 35th ASEAN summit which appears to be close to create the world’s largest trade pact. While this represents long-term bearish news for the EUR/NZD, the economic warnings in today’s New Zealand Treasury report should not be ignored and a short-term reversal, partially fueled by a short-covering rally, may materialize.
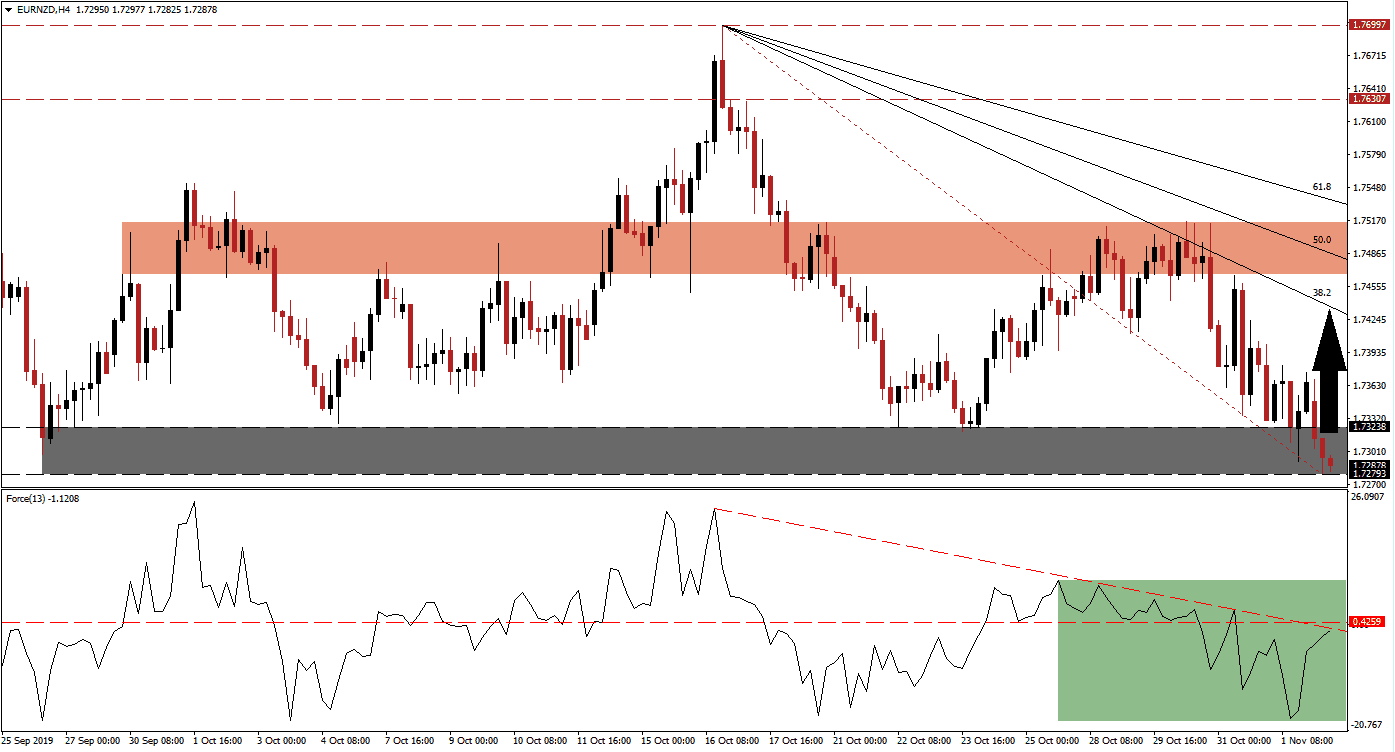
The Force Index, a next generation technical indicator, indicates the build-up in bullish momentum which is expected to result in a breakout in the EUR/NZD. The Force Index has spiked from its low and is now challenging its descending resistance level as marked by the green rectangle. While this technical indicator currently remains in negative conditions with bears in control of price action, the increase in bullish momentum is expected to result in a double breakout; above its descending resistance level as well as above its horizontal resistance level. This will turn both into support and place the Force Index into positive territory with bulls in charge of this currency pair. You can learn more about the Force Index here.
Bearish momentum is being depressed inside the support zone, located between 1.72793 and 1.73238 as marked by the grey rectangle. The end point of the Fibonacci Retracement Fan is located inside this zone and a short-term breakout is expected to close the gap between price action and the Fibonacci Retracement Fan sequence. A breakout in the Force Index is likely elevate the EUR/NZD above its support zone from where a short-covering rally will provide the necessary boost to the upside. Forex traders should also monitor the intra-day high of 1.73749 which marks the peak of the previous bounce higher; this was reversed and led to the lower low in price action. A move above this level is likely to attract fresh net buy orders into this currency pair.
An ASEAN trade pact will trump weakness in the New Zealand economy, which is heavily dependent on Australia and China on the back of commodity exports, and the long-term downtrend in the EUR/NZD should remain intact. A breakout in this currency pair is expected to remain a short-term development which may take price action into its short-term resistance zone; this zone is located between 1.74668 and 1.75152 as marked by the red rectangle. The 38.2 Fibonacci Retracement Fan Resistance Level has already crossed below this zone and may halt any advance in this currency, with the 50.0 Fibonacci Retracement Fan Resistance Level nestled inside it. You can learn more about the Fibonacci Retracement Fan here.
EUR/NZD Technical Trading Set-Up - Short-Term Breakout Scenario
Long Entry @ 1.72800
Take Profit @ 1.74200
Stop Loss @ 1.72350
Upside Potential: 140 pips
Downside Risk: 45 pips
Risk/Reward Ratio: 3.11
Manufacturing PMI data out of the Eurozone could provide a fundamental catalyst and pressure the EUR/NZD into a short-covering rally or into a breakdown and extension of the sell-off. The fundamental scenario points towards more weakness in price action, but the technical picture suggests a short-term reversal is on the horizon; such a move will extend the longevity of the downtrend. The next support zone, following a breakdown, is located between 1.70868 and 1.71370.
EUR/NZD Technical Trading Set-Up - Breakdown Scenario
Short Entry @ 1.71900
Take Profit @ 1.70900
Stop Loss @ 1.72300
Downside Potential: 100 pips
Upside Risk: 40 pips
Risk/Reward Ratio: 2.50

