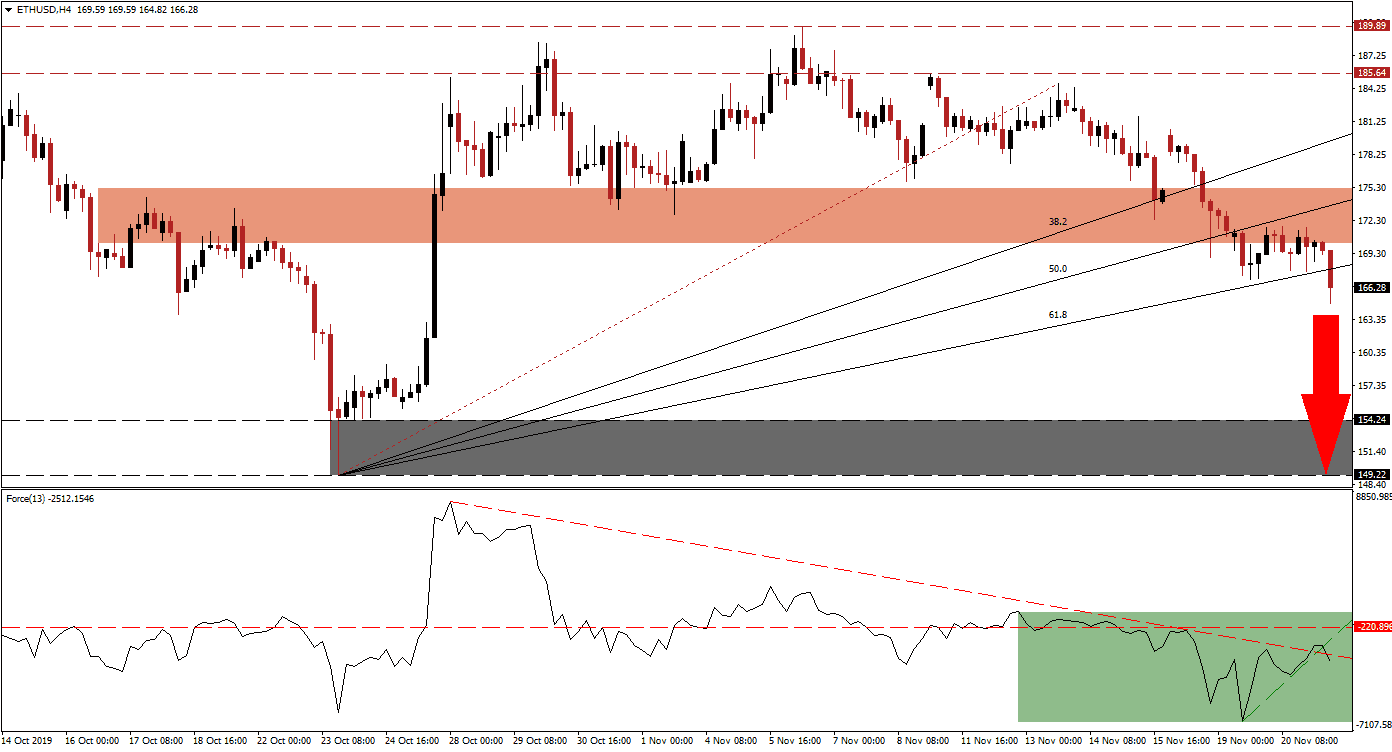
Ethereum is under fundamental bearish pressures as developers are leaving for better projects, and the world’s second-biggest cryptocurrency by market value is under threat from multiple fronts. The breakdown below its short-term support zone, that turned it into resistance, has taken price action to the ascending 61.8 Fibonacci Retracement Fan Support Level. With the rise in bearish pressures, another breakdown is expected to materialize and pressure the ETH/USD into its next long-term support zone.
The Force Index, a next-generation technical indicator, points towards a build-up in bullish momentum from depressed levels while maintaining its position in negative territory. A steep ascending support level formed which crossed above its descending resistance level and above its horizontal resistance level as marked by the green rectangle. The Force Index is anticipated to complete a breakdown below the ascending support level and lead the ETH/USD into a breakdown of its own. Bears remain in charge of price action and this technical indicator may reverse to fresh lows after reversing a brief move above its descending resistance level. You can learn more about the Force Index here.
Following the conversion of the shot-term support zone into resistance, a breakdown in price action below its 61.8 Fibonacci Retracement Fan Support Level is in the process; the short-term resistance zone is located between 170.22 and 175.17 as marked by the red rectangle. This will convert the entire Fibonacci Retracement Fan into resistance and result in more downside for the ETH/USD. Ethereum emerged as a challenger to Bitcoin as it introduced support for smart contracts which led to dApp development. Cracks in the Ethereum infrastructure has led to countless of other projects which fixed the issues and provide an overall better platform. Developers started to abandon Ethereum with TRON and Binance the main beneficiaries.
With the rise in fundamental bearish pressures and the current breakdown-in-progress, the ETH/USD should have a clear path into its support zone which is located between 149.22 and 154.24 as marked by the grey rectangle. Due to the long-term fundamental developments in Ethereum, another breakdown remains an option. The next support zone awaits this cryptocurrency pair between 118.31 and 123.51, this includes a previous price gap to the upside. You can learn more about a price gap here.
ETH/USD Technical Trading Set-Up - Breakdown Extension Scenario
⦁ Short Entry @ 166.25
⦁ Take Profit @ 149.25
⦁ Stop Loss @ 171.75
⦁ Downside Potential: 1,700 pips
⦁ Upside Risk: 550 pips
⦁ Risk/Reward Ratio: 3.09
In the event of a triple breakout in the Force Index which can elevate it above its ascending support level and maintain its position, the ETH/USD could be pushed higher by a short-covering rally. The long-term fundamental outlook remains persistently bearish, supported by the short-term technical picture. Any breakout attempt is likely to remain limited to its long-term resistance zone located between 185.86 and 189.89 which should be considered an excellent short-selling opportunity.
ETH/USD Technical Trading Set-Up - Limited Breakout Scenario
⦁ Long Entry @ 177.00
⦁ Take Profit @ 185.75
⦁ Stop Loss @ 173.25
⦁ Upside Potential: 875 pips
⦁ Downside Risk: 375 pips
⦁ Risk/Reward Ratio: 2.33

