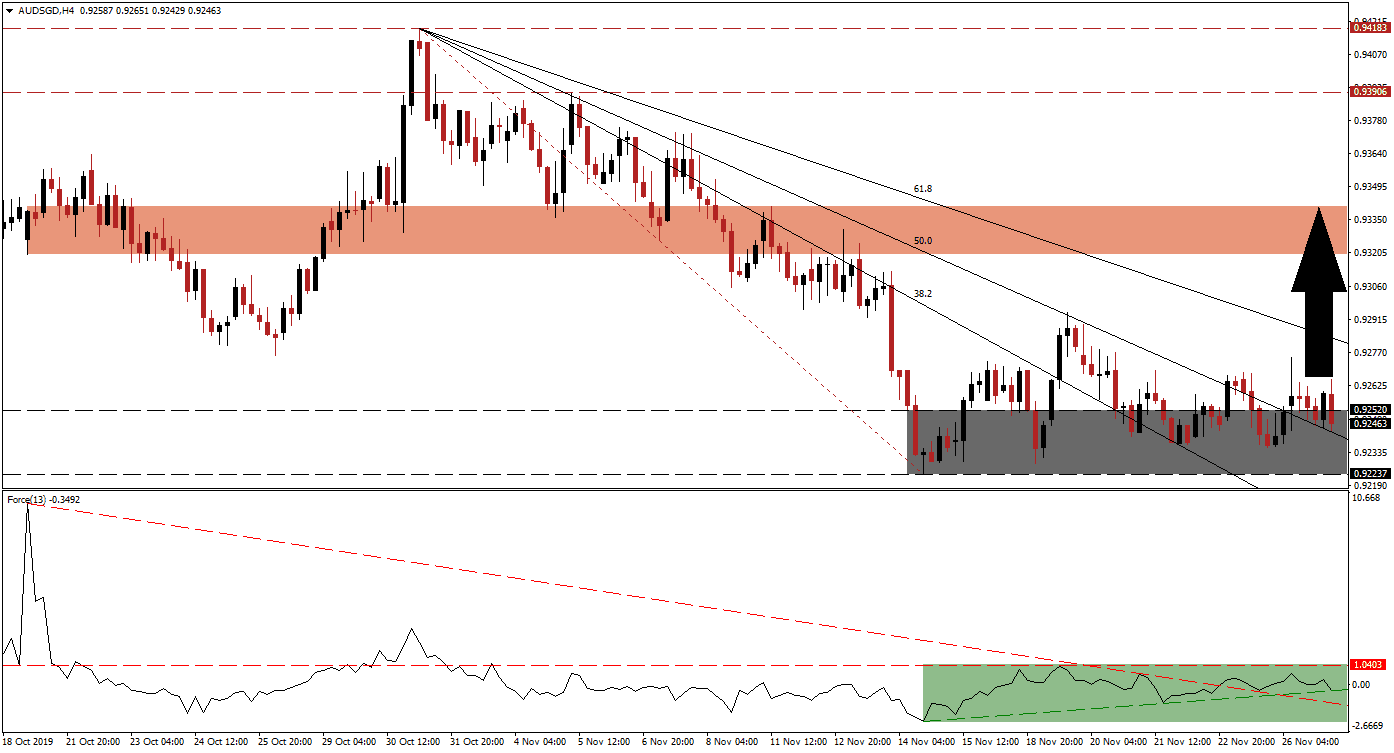
As the Hong Kong unrest continues and China labeled this weekend’s election result as manipulated by foreign actors, the positive impact on the Singapore Dollar appears to be fading. The AUD/SGD remained stuck at its support zone despite much-better-than expected annualized production data out of Singapore. Optimism about a phase one trade deal has supported the Australian Dollar, the top Chinese Yuan proxy currency, and price action has started to form a series of marginally higher lows inside its support zone. This currency pair is now on the verge of another breakout attempt.
The Force Index, a next-generation technical indicator, suggests bullish momentum is slowly on the rise as an ascending support level emerged. After the AUD/SGD moved into its support zone, the Force Index remained confined to a narrow trading range below its horizontal resistance level. Given the duration of the sideways drift, this technical indicator eclipsed its descending resistance level that currently acts as temporary support as marked by the green rectangle. A breakout in the Force Index above its horizontal resistance level will take this technical indicator into positive territory, place bulls in charge of price action, and is expected to lead a breakout in this currency pair.
Over the past nine trading sessions, five breakout attempts in the AUD/SGD have been reversed. Economic data out of China, including this morning’s industrial profit data, have highlighted a slowing economy that may tip the global economy into a recession. While five breakout attempts in this currency pair were rejected, the support zone located between 0.92237 and 0.92520 as marked by the grey rectangle has provided a floor under selling pressure. The 38.2 Fibonacci Retracement Fan Support Level has moved below this support zone as the 61.8 Fibonacci Retracement Fan Resistance Level is approaching the top range and the 50.0 Fibonacci Retracement Fan Support Level located inside of it.
Forex traders are advised to monitor the intra-day high of 0.92750 that marks the peak of the previously reversed breakout attempt. A move above this level should also take the AUD/SGD above its 61.8 Fibonacci Retracement Fan Resistance Level and a short-covering rally may follow. The next short-term resistance zone awaits this currency pair between 0.93199 and 0.93406 as marked by the red rectangle. A breakout above this zone would require a fresh fundamental catalyst, like a confirmed phase one trade truce between the US and China. The next long-term resistance zone is located between 0.93906 and 0.94183. You can learn more about a breakout here.
AUD/SGD Technical Trading Set-Up - Breakout Scenario
⦁ Long Entry @ 0.92450
⦁ Take Profit @ 0.93400
⦁ Stop Loss @ 0.92200
⦁ Upside Potential: 95 pips
⦁ Downside Risk: 25 pips
⦁ Risk/Reward Ratio: 3.80
In case of a breakdown in the Force Index below its descending resistance level, currently acting as temporary support, the AUD/SGD may follow through with a breakdown attempt below its support zone. The preceding sell-off has severely limited downside potential in this currency pair which has approached fundamentally oversold conditions. The next support zone is located between 0.91290 and 0.91870, dating back to 2001; this should be considered an excellent long-term buying opportunity.
AUD/SGD Technical Trading Set-Up - Limited Breakdown Scenario
⦁ Short Entry @ 0.91900
⦁ Take Profit @ 0.91350
⦁ Stop Loss @ 0.92150
⦁ Downside Potential: 55 pips
⦁ Upside Risk: 25 pips
⦁ Risk/Reward Ratio: 2.20

