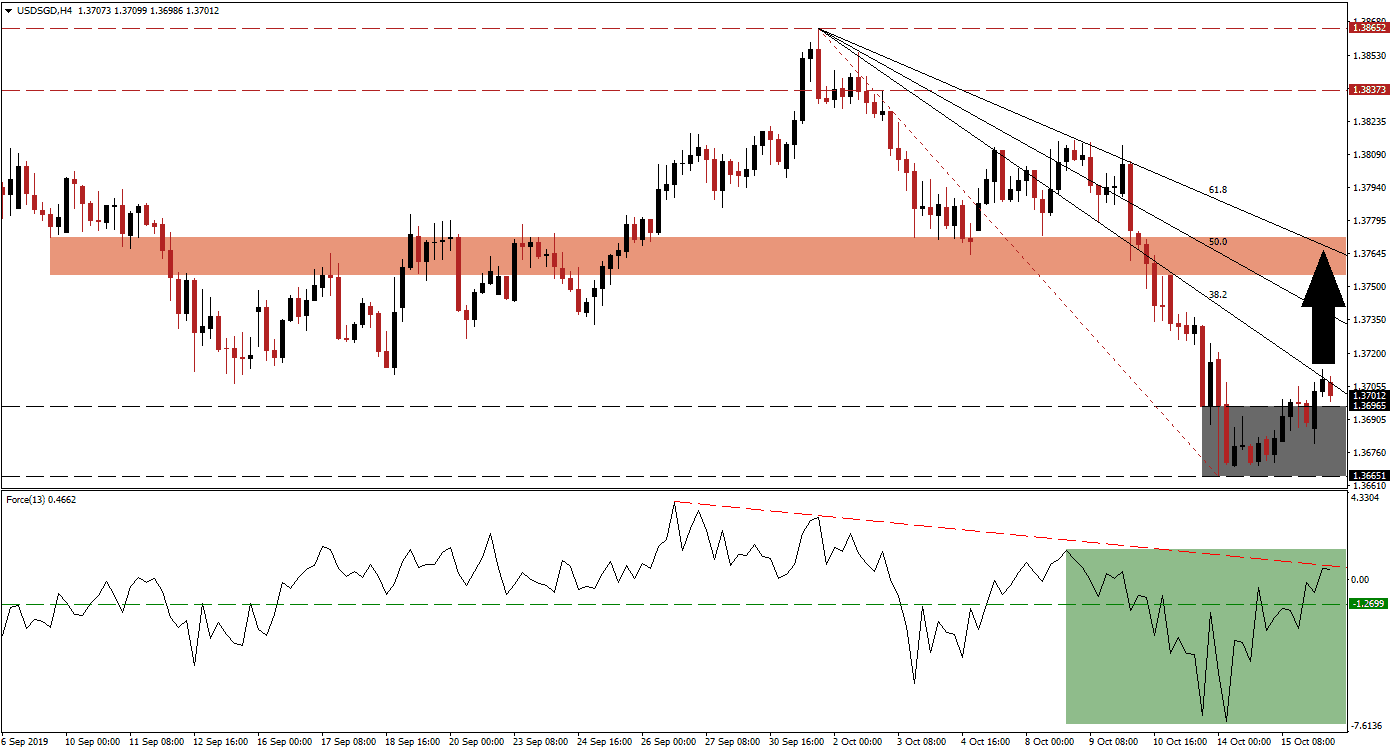
Singapore has avoided a technical recession as the preliminary third-quarter GDP expanded, but annualized growth barely avoided a standstill. This has not eliminated the recession threat as GDP data often lags actual economic performance. It was enough to extend the rally in the Singapore Dollar which took the USD/SGD into its support zone. The preceding sell-off accelerated after price action completed a breakdown below its resistance zone which pushed it through its entire Fibonacci Retracement Fan sequence, turning it from support into resistance. A short-term reversal is expected to take place on the back of a short-covering rally.
The Force Index, a next generation technical indicator, started to advance after the USD/SGD reached its support zone which suggests that bearish momentum is being depleted and a recovery is pending. After price action completed a breakout above its support zone and briefly pierced its 38.2 Fibonacci Retracement Fan Resistance Level, the Force Index followed through with a breakout above its horizontal resistance level which turned it into support; it further pushed into positive territory as marked by the green rectangle and is now faced with its descending resistance level. You can learn more about the Fibonacci Retracement Fan, the Force Index and the Support Zone here.
Price action is expected to test its support zone, located between 1.36651 and 1.36965 as marked by the grey rectangle, before attempting a short-term advance. The 38.2 Fibonacci Retracement Fan Resistance Level is approaching the top range of this support zone which is exercising additional pressures on the USD/SGD. Forex traders should monitor the Force Index, as a breakout above its descending resistance level is likely to lead price action to the upside and spark a short-covering rally as traders book floating trading profits; this is expected to be a short-term move within the long-term downtrend which should remain intact.
Ongoing capital outflow of Hong Kong continues to partially find its way into Singapore which support the Singapore Dollar. At the same time the US Fed is expected to further ease monetary policy this month which provides a fundamental catalyst to the long-term downtrend in the USD/SGD. The next short-term resistance zone is located between 1.37548 and 1.37717 which is marked by the red rectangle and the 61.8 Fibonacci Retracement Fan Resistance Level is currently nestled in this zone. A breakout above this zone is currently not expected and it will keep the downtrend alive. You can learn more about a Breakout, a Breakdown and the Resistance Zone here.
USD/SGD Technical Trading Set-Up - Breakout Extension Scenario
- Long Entry @ 1.37000
- Take Profit @ 1.37600
- Stop Loss @ 1.36800
- Upside Potential: 60 pips
- Downside Risk: 20 pips
- Risk/Reward Ratio: 3.00
A reversal in the Force Index below its horizontal support level, turning it back into resistance, could lead to a breakdown in the USD/SGD below its support zone. A close below its intra-day low of 1.36798 could trigger a fresh wave of sell orders; this level marks the low prior to the breakout above its support zone. In case of a confirmed breakdown, the next support zone is located between 1.35818 and 1.36200.
USD/SGD Technical Trading Set-Up - Breakdown Scenario
- Short Entry @ 1.36600
- Take Profit @ 1.36200
- Stop Loss @ 1.36800
- Downside Potential: 40 pips
- Upside Risk: 20 pips
- Risk/Reward Ratio: 2.00

