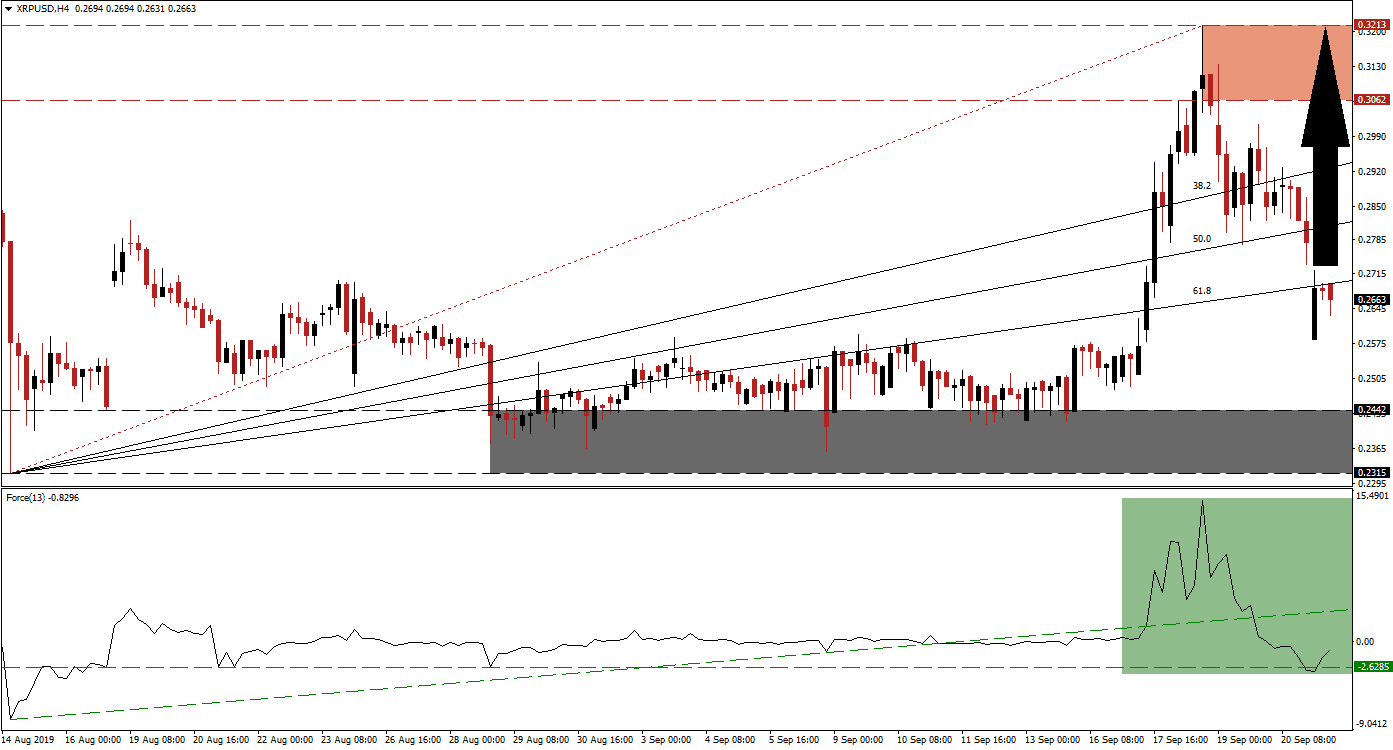
Volatility in XRP/USD spiked following a sharp price increase which took this cryptocurrency pair from the top range of its support zone through its entire Fibonacci Retracement Fan sequence into its resistance zone. This move was then reversed and resulted in a breakdown below its Fibonacci Retracement Fan sequence where price action is now awaiting the next catalyst. The sharp rally was ignited by rumors that Coinbase will partner with Ripple in order to deploy Ripple’s xRapid network for global asset transfers. Following the most recent sell-off, the Fibonacci Retracement Fan sequence was turned back into resistance.
The Force Index, a next generation technical indicator, confirmed the price spike as well as the subsequent sell-off. It has also completed a breakdown below its ascending support level which has taken momentum out of this trade, but it was bale to recover after a temporary drop below its horizontal support level. While the Force Index currently remains below the 0 center line, the momentum is positive, this is marked by the green rectangle in the chart. With XRP/USD trading just below its ascending 61.8 Fibonacci Retracement Fan Resistance Level, a move in the Force Index into positive territory could precede a breakout in price action. You can learn more about the Fibonacci Retracement Fan, the Force Index and the Support Zone here.
Following the breakdown below its 61.8 Fibonacci Retracement Fan Support Level, which tuned it into resistance, a higher low of 0.2583 formed and XRP/USD advanced back into its new resistance level. A retracement following the breakdown below a key support level is normal and the Force Index should now be monitored in order to determine if a breakout is pending or if this cryptocurrency pair will descend further. A reversal of the current price spike can take XRP/USD back down into its support zone which is located between 0.2315 and 0.2442, marked by the grey rectangle. Volatility is expected to remain high as bulls and bears are fighting over the next move near key levels.
A successful breakout above its 61.8 Fibonacci Retracement Fan Resistance Level, confirmed by a move above 0 in the Force Index, will turn it back into support and open the way to more upside. Should the Force Index move back above its ascending support level, which is now acting as resistance, XRP/USD could retrace its entire breakdown back into its resistance zone. This zone is located between 0.3062 and 0.3213 which is marked by the red rectangle. You can learn more about a Breakout, a Breakdown and the Resistance Zone here.
XRP/USD Technical Trading Set-Up - Breakout Scenario
Long Entry @ 0.2660
Take Profit @ 0.3200
Stop Loss @ 0.2550
Upside Potential: 540 pips
Downside Risk: 110 pips
Risk/Reward Ratio: 4.91
Should the Force Index fail to advance and sustain a move below its horizontal support level, XRP/USD is expected to move back into the top range of its support zone. Price action was well supported around the 0.2440 level and without a negative fundamental catalyst this support level should hold. Any short-term pull-back should be viewed as a good long-term buying opportunity in XRP/USD.
XRP/USD Technical Trading Set-Up - Breakdown Scenario
Short Entry @ 0.2525
Take Profit @ 0.2445
Stop Loss @ 0.2550
Downside Potential: 80 pips
Upside Risk: 25 pips
Risk/Reward Ratio: 3.20

