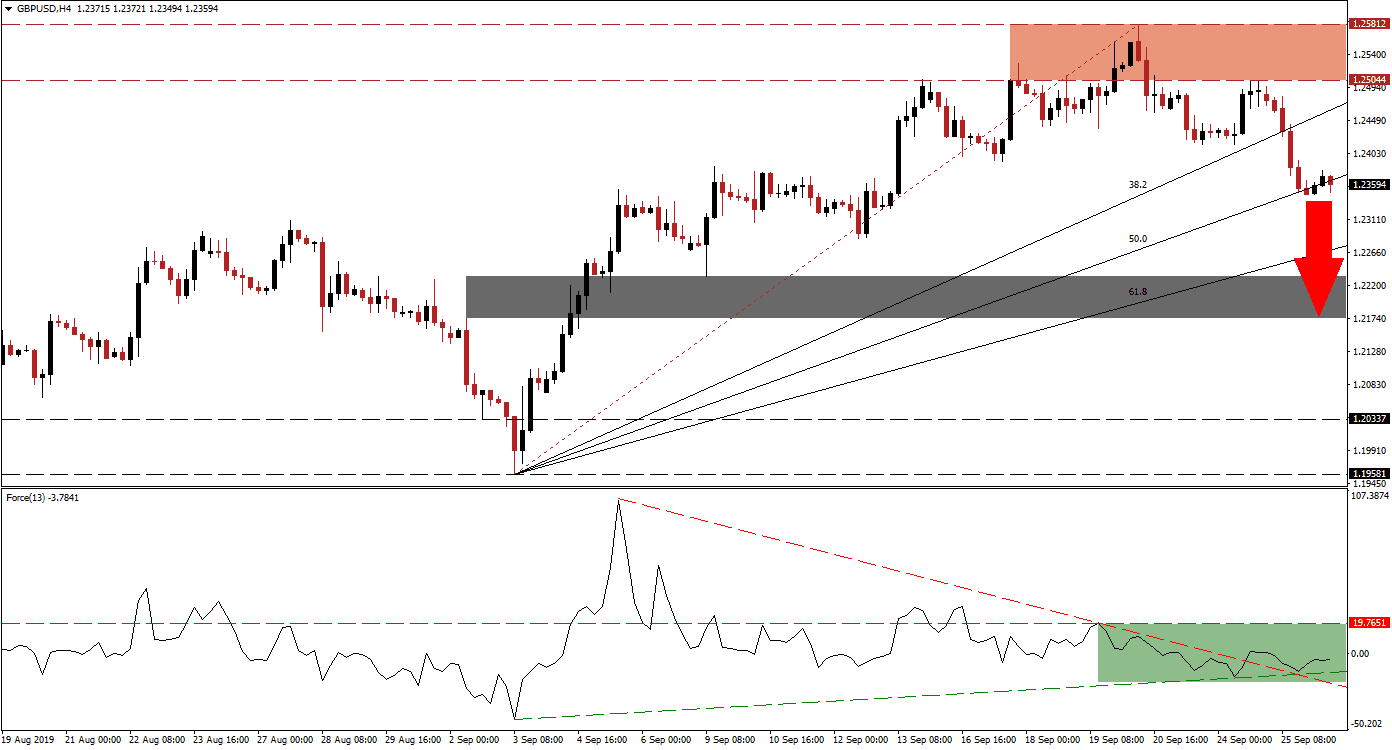
Bearish pressures on the British Pound are increasing following political uncertainty as a result of the Supreme Court verdict that Prime Minister Johnson’s prorogation of Parliament was unlawful. Following a strong rally from depressed levels, the GBP/USD reversed course with a breakdown below its resistance zone. Price action pushed below its 38.2 Fibonacci Retracement Fan Support Level, turned it into resistance and extended its slide into its 50.0 Fibonacci Retracement Fan Support Level where the sell-off took a breather. Volatility is expected to remain elevated with the Brexit clock ticking down.
The Force Index, a next generation technical indicator, flashed warning signals as the rally in the GBP/USD unfolded. After the initial spike following the breakout in the GBP/USD above its long-term support zone, located between 1.19581 and 1.20337, this technical indicator started to contract while price action accelerated higher. This resulted in the formation of a negative divergence, a bearish trading signal. As this currency pair recorded its current intra-day high of 1.25812, the Force Index index descended further and into negative territory. The Force Index remains below its horizontal resistance level, but just above its ascending support level as well as its descending resistance level as marked by the green rectangle. You can learn more about the Fibonacci Retracement Fan, the Force Index and the Support Zone here.
While the US Dollar is facing plenty of headwinds of its own with the potential of a political crisis, the current fundamental picture suggests that traders should account for an extension of the sell-off. The GBP/USD is currently trading above-and-below its 50.0 Fibonacci Retracement Fan Support Level from where a sustained move lower should emerge, especially if the Force Index will remain below its horizontal resistance level. A confirmed breakdown can take price action through its 61.8 Fibonacci Retracement Fan Support Level an into its short-term support zone which is located between 1.21742 and 1.22330 as marked by the grey rectangle.
Forex traders should monitor the Force Index as a push below its ascending support level is likely to result in the addition of new net short positions in the GBP/USD. The descending resistance level which emerged as price action advanced into its resistance zone, located between 1.25044 and 1.25812 as marked by the red rectangle, is expected to lead to more downside in the Force Index followed by contraction in price action. A contraction into its short-term support zone will keep the longer term uptrend intact. You can learn more about a Breakout, a Breakdown and the Resistance Zone here.
GBP/USD Technical Trading Set-Up - Breakdown Extension Scenario
Short Entry @ 1.23550
Take Profit @ 1.21950
Stop Loss @ 1.24000
Downside Potential: 160 pips
Upside Risk: 45 pips
Risk/Reward Ratio: 3.56
Should the ascending support level guide the Force Index higher and push it through its horizontal resistance level, the GBP/USD could recover back into its resistance zone. The dynamic developments of political issues on the US and the UK could provide the required fundamental catalyst for volatile price swings, depending which country is perceived as facing the bigger problem to tackle. From a technical perspective, this currency pair can extend its sell-off.
GBP/USD Technical Trading Set-Up - Price Action Reversal Scenario
Long Entry @ 1.24200
Take Profit @ 1.25300
Stop Loss @ 1.23750
Upside Potential: 110 pips
Downside Risk: 45 pips
Risk/Reward Ratio: 2.44

