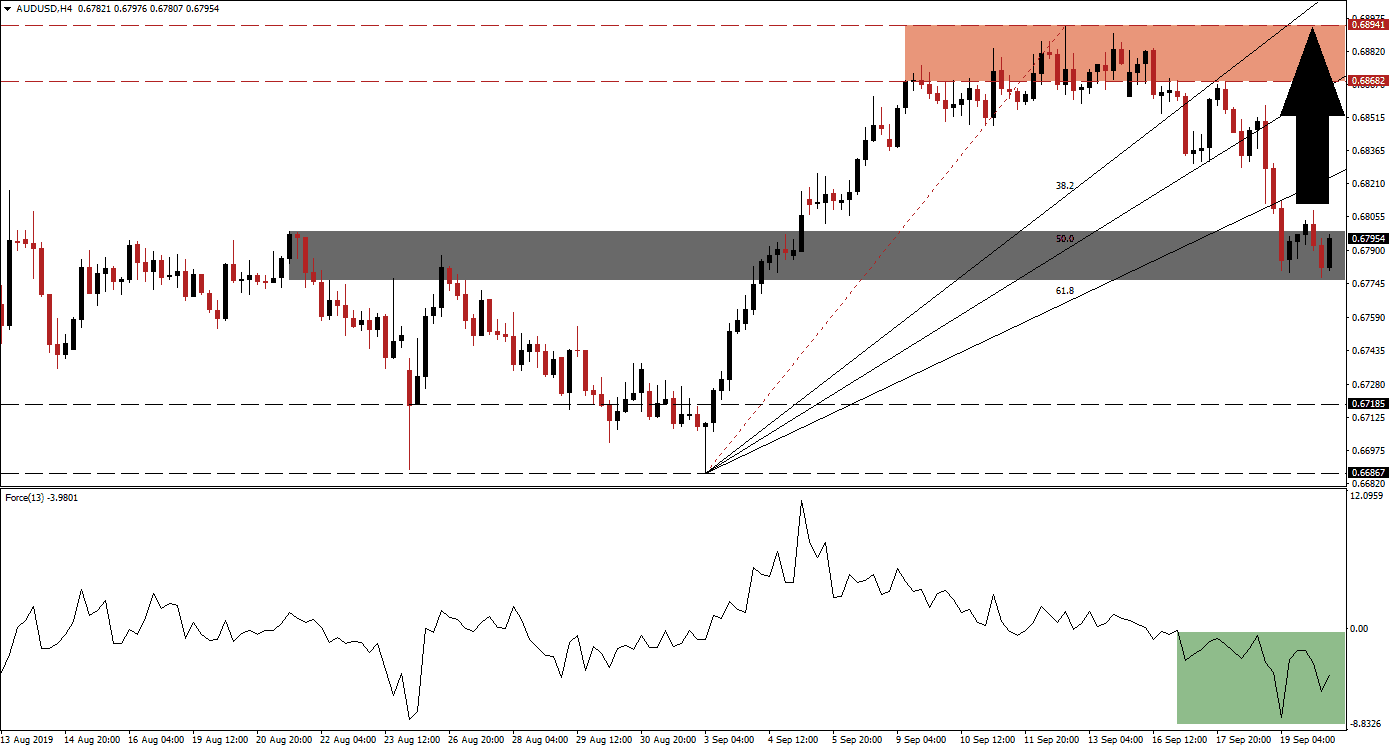
The Australian Dollar came under selling pressure as trade fears between the US and China have surfaced once again. Distrust between both countries is growing which makes a deal in October, when representatives of both countries meet in Washington for the next round of talks, very unlikely. The AUD/USD, after recording an intra-day high of 0.68694 which marks the top range of its resistance zone, completed a breakdown which took it below the entire Fibonacci Retracement Fan Sequence turning it from support to resistance. Price action is now trading below its 61.8 Fibonacci Retracement Fan Resistance Level, but above its next support zone.
The Force Index, a next generation technical indicator, confirmed the initial breakdown below its resistance zone with the formation of a negative divergence; this refers to an increase in price and a decrease in the underlying technical indicator. After the AUD/USD reached its support zone, the Force Index started to recover as marked by the green rectangle. It remains below the center line which is set at 0 and bear remain in control for now, but bearish pressures are easing as this currency pair is stabilizing. You can learn more about the Fibonacci Retracement Fan, the Force Index and the Support Zone here.
The current short-term support zone is located between 0.67776 and 0.67987 as marked by the grey rectangle. The Force Index should now be closely monitored in order to determine if support levels can hold and a breakout can materialize. Following a breakdown below its Fibonacci Retracement Fan Sequence, it is normal for price action to retrace the breakout. Should the Force Index ascend as the AUD/USD is approaching its ascending 61.8 Fibonacci Retracement Fan Resistance Level, another breakout may follow and take price action back into its resistance zone.
Following a confirmed breakout above its support zone and a push above its 61.8 Fibonacci Retracement Fan Resistance Level, the next key price level to watch out for is the intra-day low of 0.68301. This level represents a previous pause in the sell-off after the AUD/USD reached its 50.0 Fibonacci Retracement Fan Resistance Level which resulted in a brief advance to the bottom range of its resistance zone; the sell-off resumed after that and lead to a series of breakdowns. The current long-term resistance zone is located between 0.68682 and 0.68941 which is marked by the red rectangle. You can learn more about a Breakout, a Breakdown and the Resistance Zone here.
AUD/USD Technical Trading Set-Up - Breakout Scenario
Long Entry @ 0.67950
Take Profit @ 0.68900
Stop Loss @ 0.67700
Upside Potential: 95 pips
Downside Risk: 25 pips
Risk/Reward Ratio: 3.80
A failure in the AUD/USD to sustain a push above 0.67987 coupled with a reversal in the Force Index could lead to a breakdown and extension of the sell-off. The next long-term support level is located between 0.66867 and 0.67185.
AUD/USD Technical Trading Set-Up - Breakdown Scenario
Short Entry @ 0.67600
Take Profit @ 0.66850
Stop Loss @ 0.67900
Downside Potential: 65 pips
Upside Risk: 25 pips
Risk/Reward Ratio: 2.60

