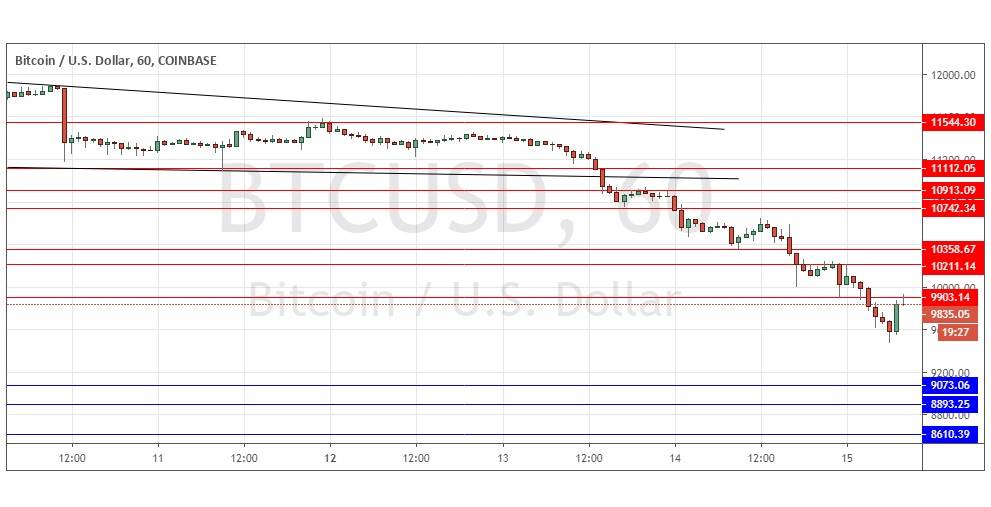
Bitcoin: Strong bearish breakdown
Yesterday’s signals were not triggered as there was no sufficiently bearish price action when any of the identified support levels were reached.
Today’s BTC/USD Signals
Risk 0.50% per trade.
Trades must be taken prior to 5pm Tokyo time Friday.
Long Trade Ideas
Go long at a bullish price action reversal on the H1 time frame following the next touch of $9,073, $8,893, or $8,610.
Place the stop loss 1 pip below the local swing low.
Adjust the stop loss to break even once the trade is $50 in profit by price.
Take off 50% of the position as profit when the trade is $50 in profit by price and leave the remainder of the position to ride.
Short Trade Ideas
Go short after a bearish price action reversal on the H1 time frame following the next touch of $9,903, $10,211 or $10,359.
Place the stop loss 1 pip above the local swing high.
Adjust the stop loss to break even once the trade is $50 in profit by price.
Take off 50% of the position as profit when the trade is $50 in profit by price and leave the remainder of the position to ride.
The best method to identify a classic “price action reversal” is for an hourly candle to close, such as a pin bar, a doji, an outside or even just an engulfing candle with a higher close. You can exploit these levels or zones by watching the price action that occurs at the given levels.
BTC/USD Analysis
I wrote yesterday that the trends were mixed on different time frames so any solid rejection of a key level nearby could be a good trade entry, whether long or short. I thought that the best trade which might set up later would be a short trade from a retrace to $10,742 followed by a bearish reversal.
This wasn’t a great call as the price fell more strongly than I thought it would, although I was correct to look more towards the short than the long side.
The price will probably continue to be bearish as long as the resistance level at $9,903 holds. It would be significant for the price to spend a considerable amount of time below the psychological level of $10,000.
On the bullish side, if you look at a long-term chart such as the daily chart, you can see we are quite close to very key support at $9,073 so there could be a good long-term buying opportunity if the price gets down there again soon.
I would take a bearish bias if we get a strong bearish reversal from a retrace to $10,211 later. Regarding the USD, there will be releases of Core Retail Sales, Retail Sales, and the Philly Fed Manufacturing Index at 1:30pm London time.
