Last Wednesday’s piece ended with only one prediction applicable to the price action that has taken place since then:
1. A sustained break of 1.6150 will be a mildly bullish sign, but there will probably not be much more room to move upwards, so potential is likely to be limited.
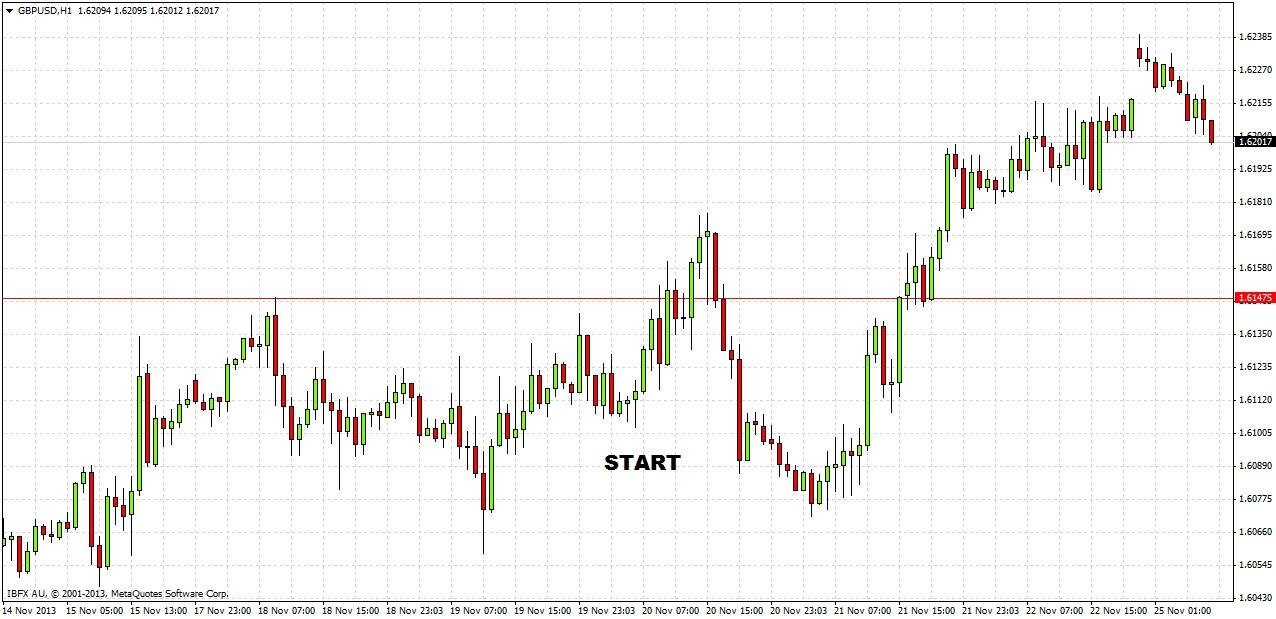
To see how things have worked out since then, let's take a look at the 1 hour chart below:
We did break 1.6150 the day of the forecast, and it was not a particularly sustained break, but it did recur the following day and lead to a - so far - rather limited move upwards, as we forecast.
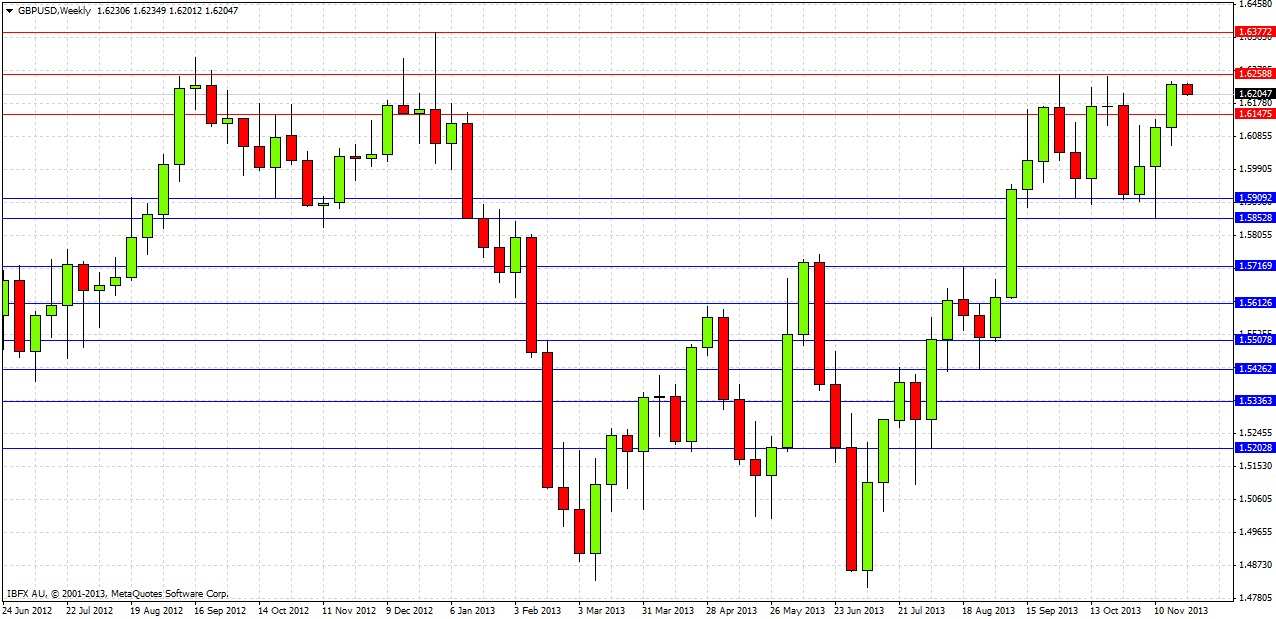
Looking to the future now, let's begin with the weekly chart:
Last week printed a bullish bar that closed right on its high, well above last week’s high. We are now close to the double top at 1.6250 that has acted as strong resistance over the previous couple of months.
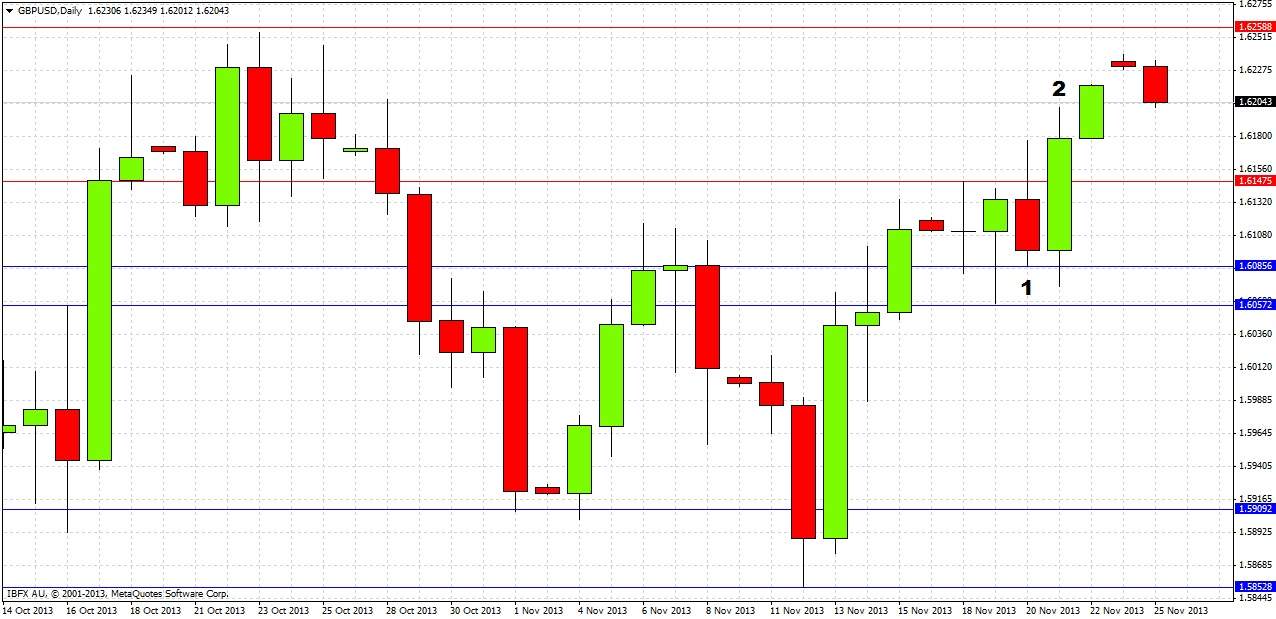
Turning now to the daily chart:
Last Wednesday, the day of our previous prediction, closed as a bearish reversal bar, marked at (1), rejecting the resistance level at 1.6150. However the following day printed a very bullish outside reversal bar that closed near its high, marked at (2), leading to a further rise and new high on Friday and a weekly close right on the weekly high.
A careful look at the daily chart reveals a loose zone of resistance turned into support between 1.6086 and 1.6057 that is not visible from the weekly action.
This week opened a little higher last night, but the price has been falling today, filling the small weekend gap already.
It is possible that the broken resistance at 1.6150, still marked on the daily chart above, may act as support when next tested.
It seems logical to stick with mostly the same conclusions as before:
1. No overall directional bias, until there is a sustained break above 1.6250 (bullish) or below 1.6050 (bearish).
2. Another test of 1.6250 offers an opportunity to short but not a touch trade; it should be confirmed by a price action candle.
3. A sustained break of 1.6050 should lead to price reaching 1.5900 or very close to it fairly soon afterwards.
4. A sustained break of 1.5850 to the downside would be a very bearish sign and should send the price down to 1.5750 fairly quickly.
5. A sustained break of 1.6250 to the upside will have unpredictable consequences until 1.6377 is surpassed, which would be an extremely bullish sign.
6. The 1.6150 level may act as support and could be a good level to look for a long trade if the price runs out of downwards momentum there.
7. A fast move down to 1.6050 could provide a good opportunity for a long trade.


