Last Thursday's analysis ended with the following predictions relevant to what has happened since:
1. The uptrend may reverse, or just pause
2. Trading off S/R levels likely to be wisest course of action until direction becomes clearer
3. Long touch trade at fast move down to 1.3650
4. Should the price decisively break below 1.3640, this would be a bearish sign that we will approach 1.3500
5. A long close to 1.3500 will probably be a good trade.
6. The support at 1.3703 may not be strong, but the other support levels identified should be strong
Let's take a look at the hourly chart to see how things actually turned out:

The prediction was correct in highlighting a possible reversal in the uptrend, as the price has just fallen sharply without any meaningful pull back since then. The recommended long touch trade at 1.3650 would have yielded nothing. The price reached the key 1.35 level towards the end of Friday’s trading, spiking as low as 1.3441 early this morning, so any longs there may have been stopped out by now. However at the time of writing price is going up above 1.35. Our prediction that the price would approach 1.3500 if there were a decisive break down of 1.3640 certainly proved to be correct.
Turning to the future, it is a new month, so let's start by taking a look at the monthly chart below:

Last month’s candle closed as a bearish pin bar. No month has been able to close above 1.3611 during the past two years. So although the chart has been showing a bullish trend for a while, we now have a bearish sign of trend reversal.
Let’s go to the weekly chart:

Last week was an extremely long-bodied bearish candle. It has engulfed the real bodies of the last five candles and closed very close to its low. This is very bearish but this pair usually does pull back somewhat after lengthy moves, and the 1.3500 zone has provided strong support recently, so we may not see price maintaining this bearish momentum.
Let's drop down to the daily chart again to try to find some more detail:
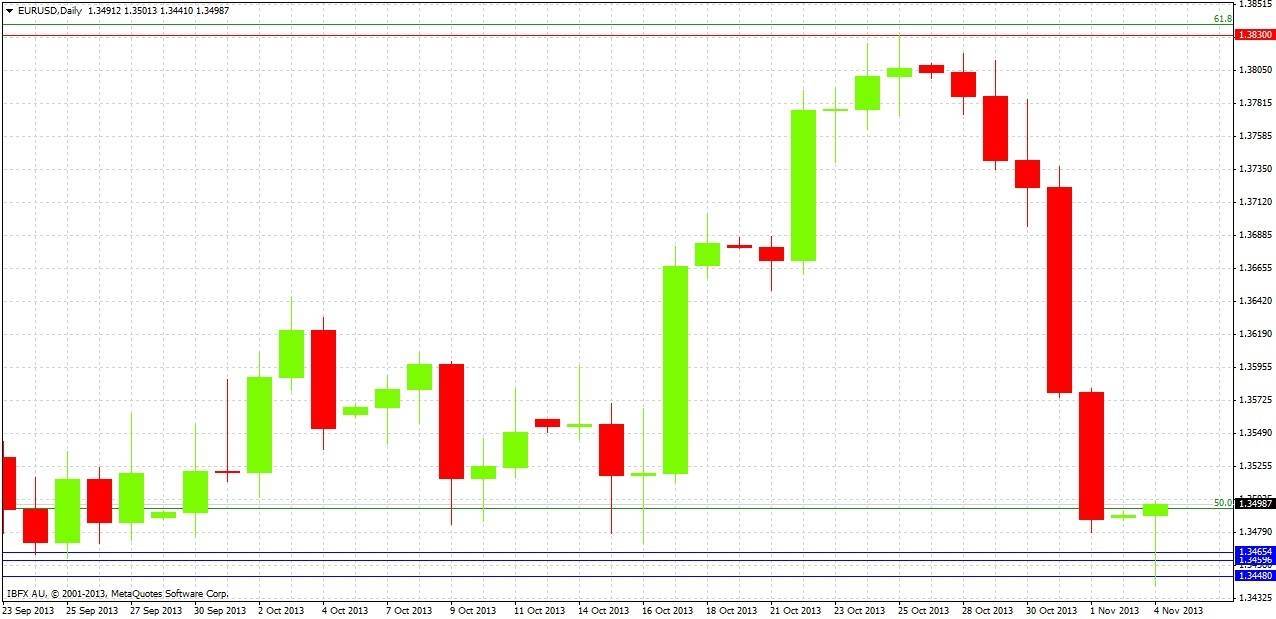
The daily chart shows that there has been a very sharp parabolic fall during the past few days, with the last two daily candles closing very close to their respective lows. We are now right back at the base of the rally, the key 1.3500 support level and the 50% retracement level of the long-term 2011-12 downwards move.
It seems that the uptrend is over for the time being, but the 1.3440-1.3500 zone might well continue to hold for a while at least. The only predictions that can be made today are:
1. A determined break below 1.3450 will be a strongly bearish sign, and should that happen the price may well continue to fall towards 1.3100.
2. If we do not return to 1.3440-50 zone for at least a couple of days, it should prove to be strong support.
EUR/USD: Sharp Fall to 1.3450 Support

Adam Lemon began his role at DailyForex in 2013 when he was brought in as an in-house Chief Analyst. Adam trades Forex, stocks and other instruments in his own account. Adam believes that it is very possible for retail traders/investors to secure a positive return over time provided they limit their risks, follow trends, and persevere through short-term losing streaks – provided only reputable brokerages are used. He has previously worked with...
Read more Adam Lemon began his role at DailyForex in 2013 when he was brought in as an in-house Chief Analyst. Adam trades Forex, stocks and other instruments in his own account. Adam believes that it is very possible for retail traders/investors to secure a positive return over time provided they limit their risks, follow trends, and persevere through short-term losing streaks – provided only reputable brokerages are used. He has previously worked within financial markets over a 12-year period, including 6 years with Merrill Lynch.