By: DailyForex.com
Last's Monday’s analysis ended with the following predictions relevant to the price movements that have occurred this week:
1. Weakly bullish bias (this was the title, apologies for the bearish typo at the conclusion of the article).
2. A break with momentum up through last week's high of 1.3505 will be a mildly bullish sign suggesting 1.3550 or very close to it.
3. A long trade is recommended from any bullish reversal bar on the hourly chart.
Let's take a look at the hourly chart to see how things turned out since then:
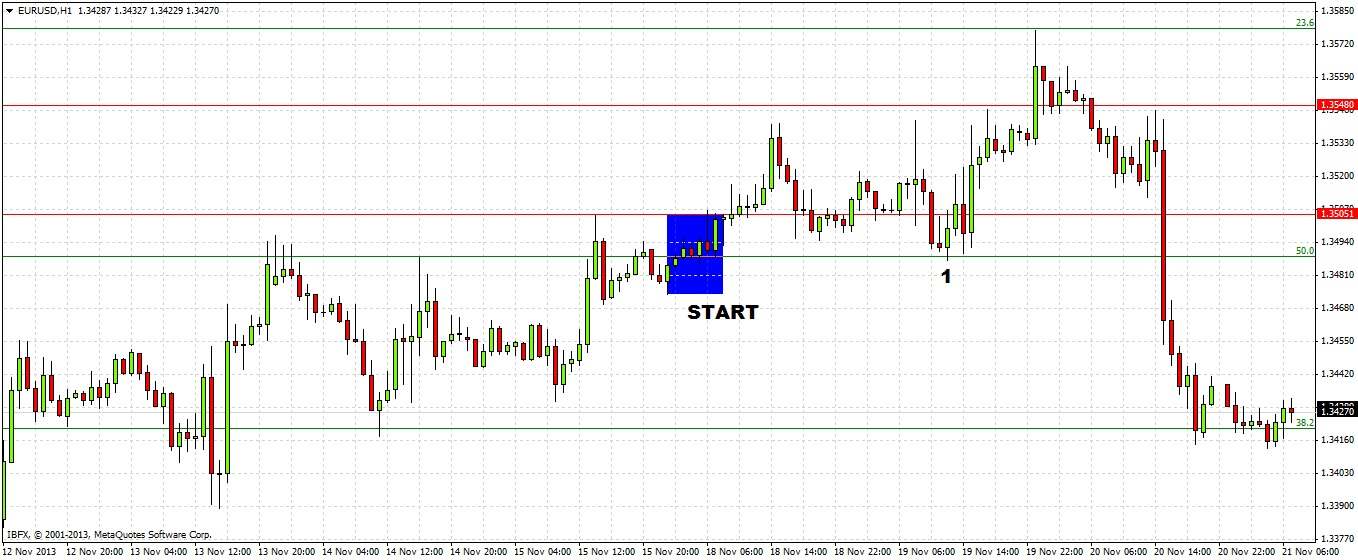
All in all, the prediction worked well, although the weakly bullish bias was only good for two days.
The level of 1.3505 was not really broken with strong momentum, although the breakthrough was accomplished by a sequence of three bullish reversal bars highlighted in blue on the chart above, which did lead to an immediate move up just a few pips short of 1.3550. Long trades here and again from another bullish reversal bar early Tuesday midday, marked at (1) on the chart above, could have produced about 60 pips of profit.
Turning to the future now, let's take a look at the weekly chart below:
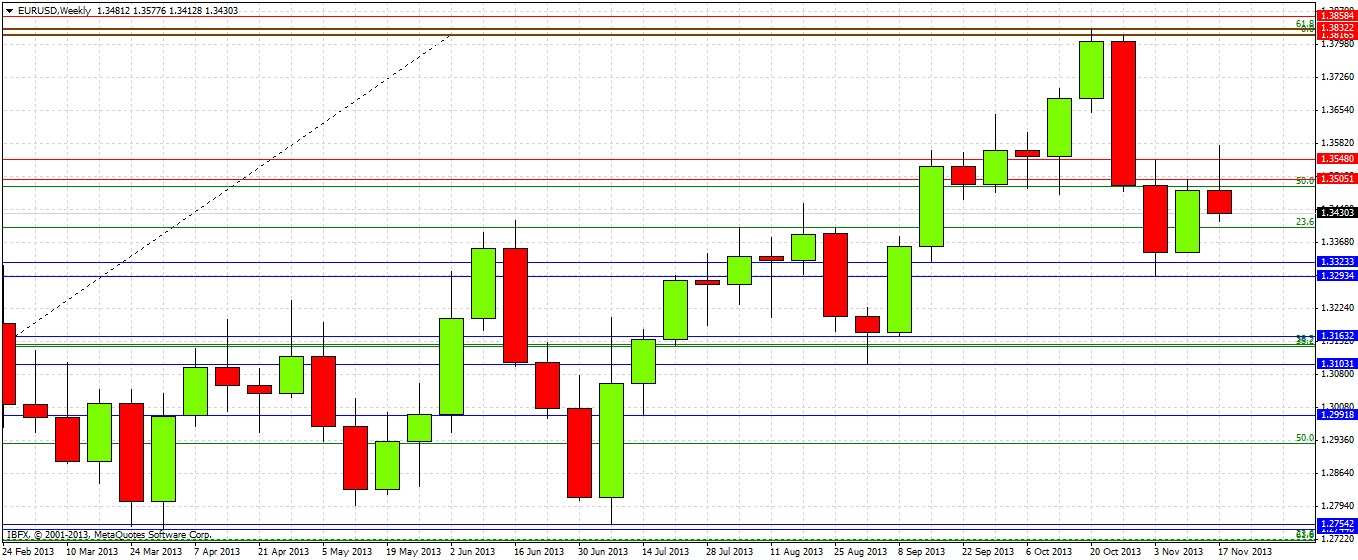
Last week printed a bullish inside candle. Note though that it was unable to close above the 50% Fibonacci retracement level at around 1.3500, and that this week's break upwards through the level has reversed strongly, with this week's candle currently showing a bearish pin bar rejecting that level. The weekly chart shows the recent impulsiveness has been more on the short side, and with the rejection of that 50% level and round number confluent that was previously acting as support, it looks like a bearish picture
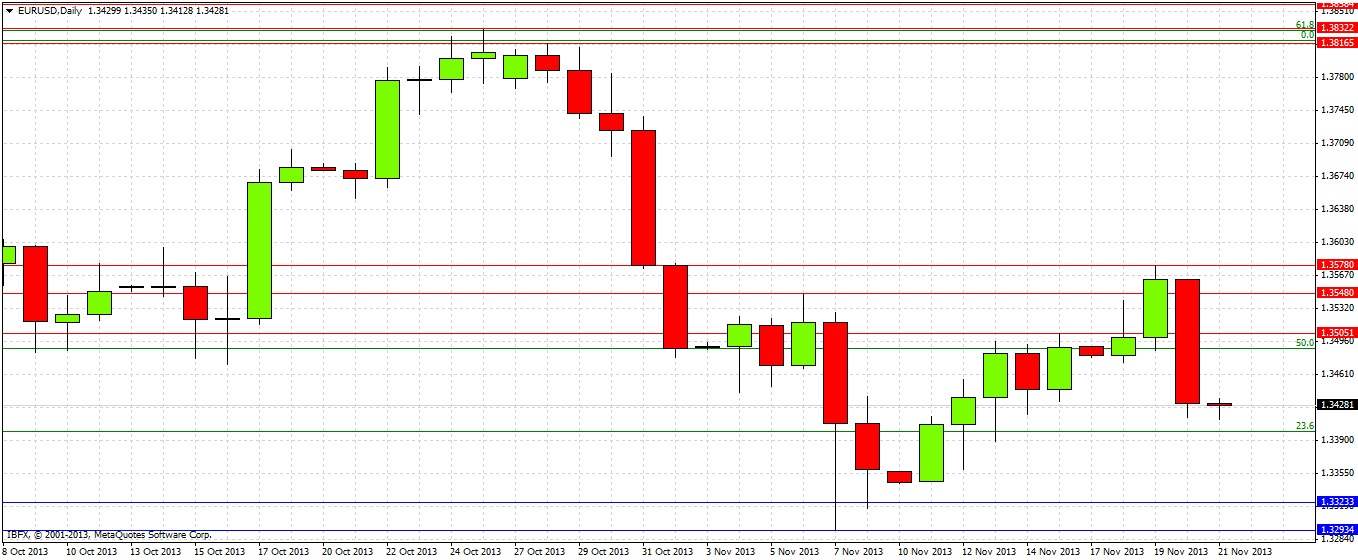
Of course, the bearishness came suddenly yesterday with Bernanke's comments. We can look in more detail at how things developed over time with a close look at the daily chart below
The chart shows a run of 8 successive days with higher lows that ended yesterday with a strong bearish reversal bar. As we have also rejected a key level and had fairly high impact news from Bernanke, it makes sense to turn bearish now. However we are sitting at the time of writing in a minor support zone close to some recent daily lows and a minor Fibonacci level, so we may need a pull back before we can fall down past 1.3400. There is no obvious level to look for a pull back to except possibly 1.3432.
A slow drift back up to 1.3500 and a bearish reversal there would produce a good opportunity for a short.
Therefore predictions / forecasts now stand as follows:
1. Overall bearish bias, but less so if there is no sustained break of 1.3400 today.
2. Initial target 1.3300 – 1.3320
3. Possible good shorting levels include 1.3432 with a bearish reversal bar on the short term chart, and 1.3500 if there is a slow move up there, also with a confirmation bar.


