Our previous analysis last week ended with the following predictions relevant to the price movements that have occurred since then:
1. Bearish bias, ranging
2. It is possible to scalp bounces off 0.9388 under relaxed market conditions.
3. A sustained break below 0.9279 will probably take a while to break below 0.9225.
4. A sustained break above 0.9388 is likely to lead to more ranging and consolidation rather than a strong upwards move.
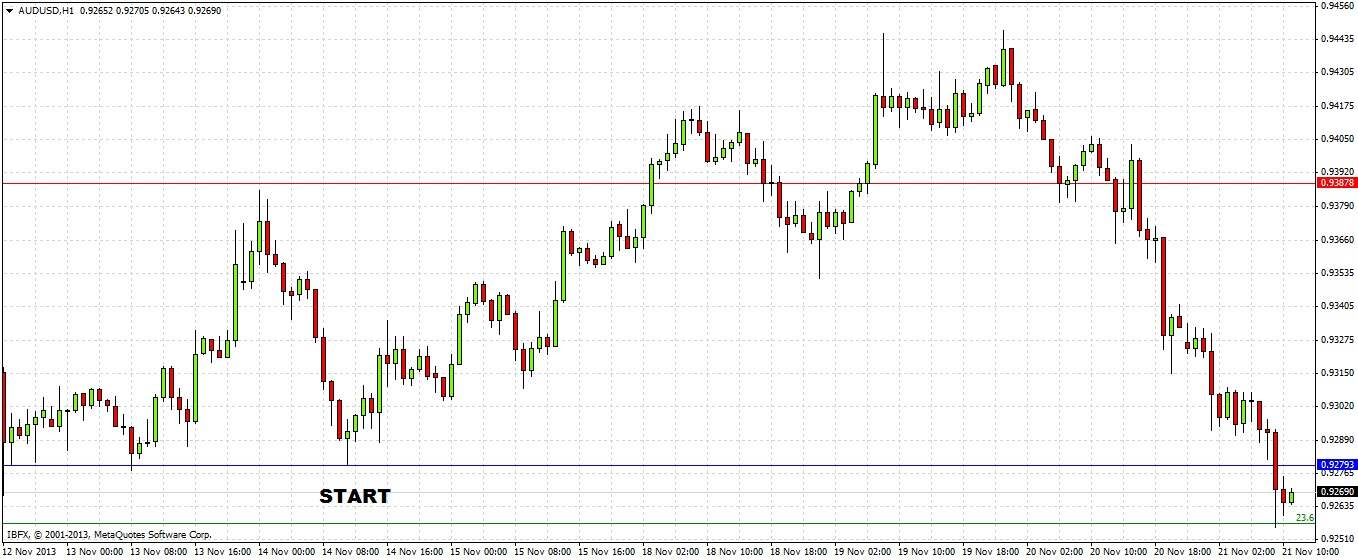
Essentially, we were right about 1. and 4. but wrong about 2. which would have led to a losing trade. The jury is still out on 3. The break above 0.9388 marked at (1) in the hourly chart below ushered in a period during which the range has been fairly wide and clean, but a range nevertheless:
Turning to the future, let's start with a look at the weekly chart:
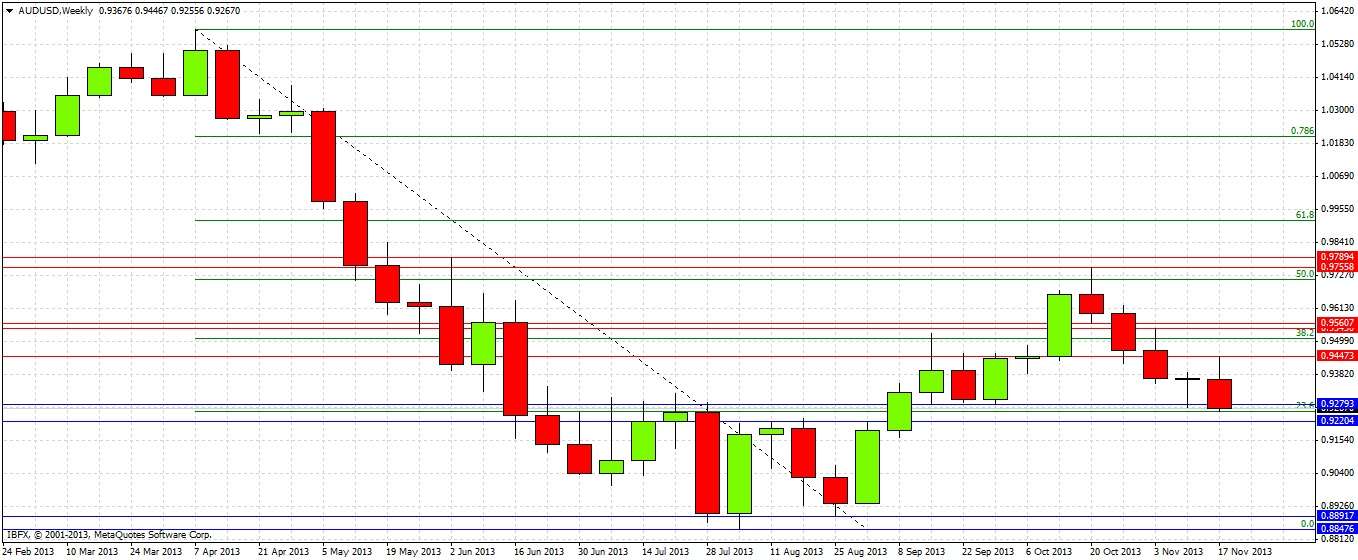
Last week printed a small bullish pin bar sitting on the established support level of 0.9279 which is both a double bottom and resistance turned into support. However the high of the bar has not broken and in fact the support broke jut a few hours ago, although we have not been able to penetrate the 23.6% Fibonacci retracement level of the recent long down wave. The current weekly candle is forming a bearing outside and reversal bar. Although things look very bearish, we are sitting right now on a strong support zone down to 0.9220.
Let's take a closer look with the daily chart:
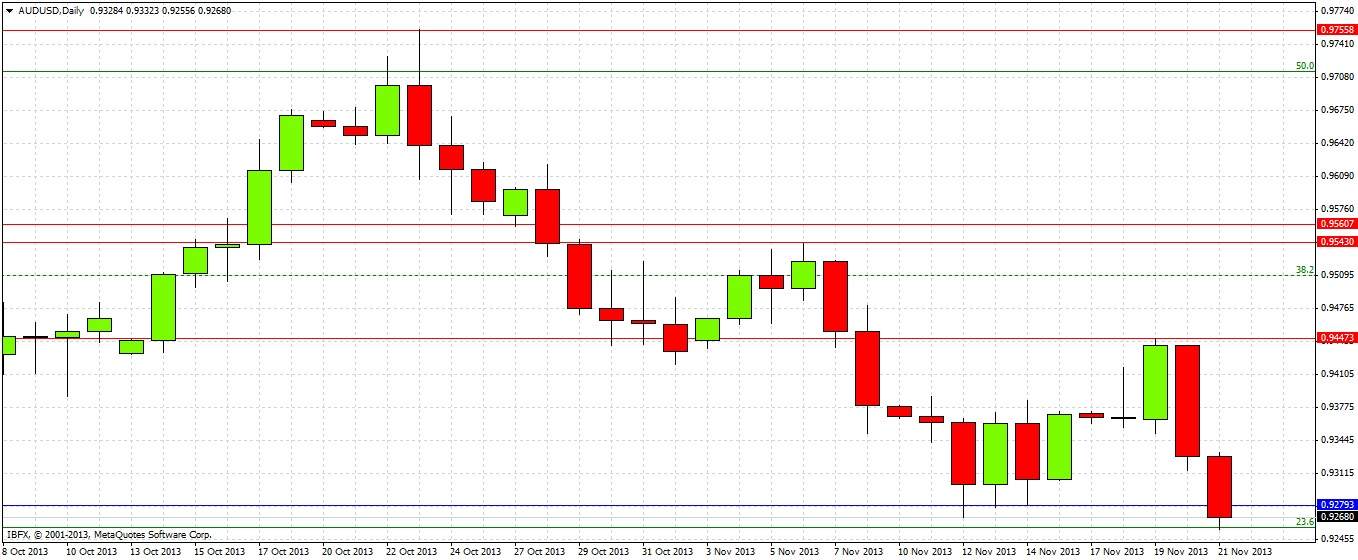
After a few days of struggling bullishness which took us up to the swing high of 0.9447, the high of that bullish outside candle failed to break yesterday, forming instead a very strong bearish reversal bar. We have continued lower today, breaking support at 0.9279, but so far unable to break 0.9250.
Things certainly look bearish, but after a pretty sharp fall of almost 100 pips to a strong support zone, it has to be asked how much further this pair can fall right away.
The key variables today and tomorrow will be whether the psychological level of 0.9250 and the pivotal support level of 0.9220 will hold. It is likely that they will, and that there will be some pull back before the bearish trend can get enough momentum to break through 0.9220. A strong break of 0.9220 has the potential to lead quickly to a sharp fall all the way to 0.9000 and beyond.
Should today close very bearishly near the bottom of its daily range, the obvious zone to look for shorts would be a pullback tomorrow or Monday to the area between yesterday's low and today's current high.
From this analysis we can make the following predictions and recommendations:
1. Impossible to be properly bearish from here until 0.9220 breaks down.
2. There is strong support between 0.9255 and 0.9220.
3. Possible to take long touch trades if there is a fast move down today to 0.9250 or 0.9220.
4. A sustained break down of 0.9220 should signal a fall to 0.9000 and beyond.
5. If today closes in the bottom quarter of its range but above 0.9220, Friday or Monday could offer a good short off a bearish reversal candle in the zone between today's current high of 0.9332 and yesterday's low of 0.9315.
6. A break above 0.9450 is unexpected but would be a strongly bullish sign signifying a further move up to 0.9540.


