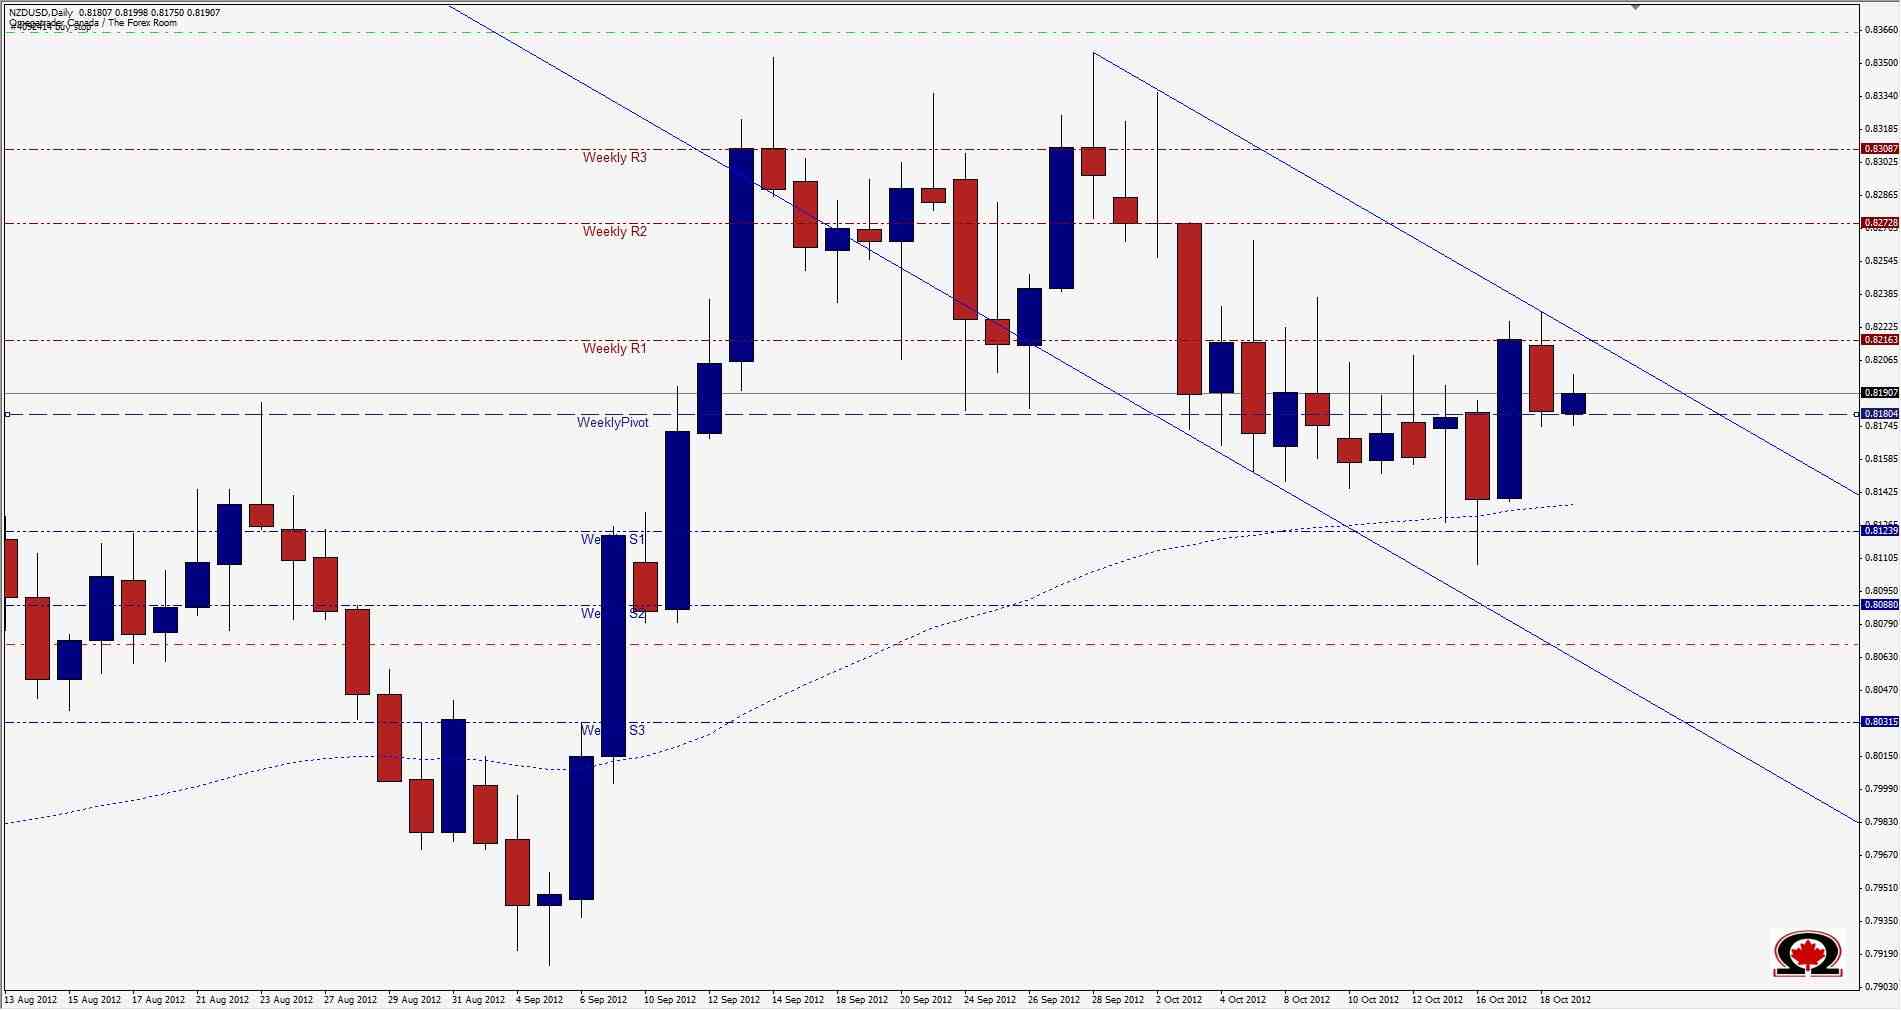
The NZD/USD tested the top of the descending channel it has been trading in since mid September in yesterday's trading, but rejected (at least so far) anything above 0.8230 making a daily high of 0.82297. The pair has clearly established a resistance level at about 0.8216 where the Weekly R1 currently resides. This level has been tested roughly 8 of the last 11 trading days but seems determined to keep trying. The pair is also finding support at 0.8150 and 0.8135(50% Fibo) between the Weekly S1 of 0.8123 and the Weekly Pivot at 0.8180. Since the overall trend is upwards, a break higher is still possible if the current resistance level breaks. A close above 0.8300 on the daily time frame could signal a solid push higher as it will then have broken the descending channel with some strength. If lower prices are in store, the next zone will probably be the bottom of the channel at the Weekly S2 and 61.8% FIBO level 0.8081. Any trading below that will possibly bring on a new down trend with September's low of 0.7914 the likely target before possibly heading for 0.7790.
Kiwi Tests & Rejects Resistance
By Colin Jessup
Colin Jessup is certified in both Securities & Technical Analysis from the Canadian Securities Institute, founder of Omegatrader Canada and a Live Trading Coach at TheTradingCanuck.com, a service that calls live trades to captures dozens of pips daily with low drawdown....
Read more Subscribe Sign up to get the latest market updates and free signals directly to your inbox. *By registering you agree to receive communications.
Please enter a valid email address

By Colin Jessup
Colin Jessup is certified in both Securities & Technical Analysis from the Canadian Securities Institute, founder of Omegatrader Canada and a Live Trading Coach at TheTradingCanuck.com, a service that calls live trades to captures dozens of pips daily with low drawdown.
- Labels
- NZD/USD
