By: DailyForex.com
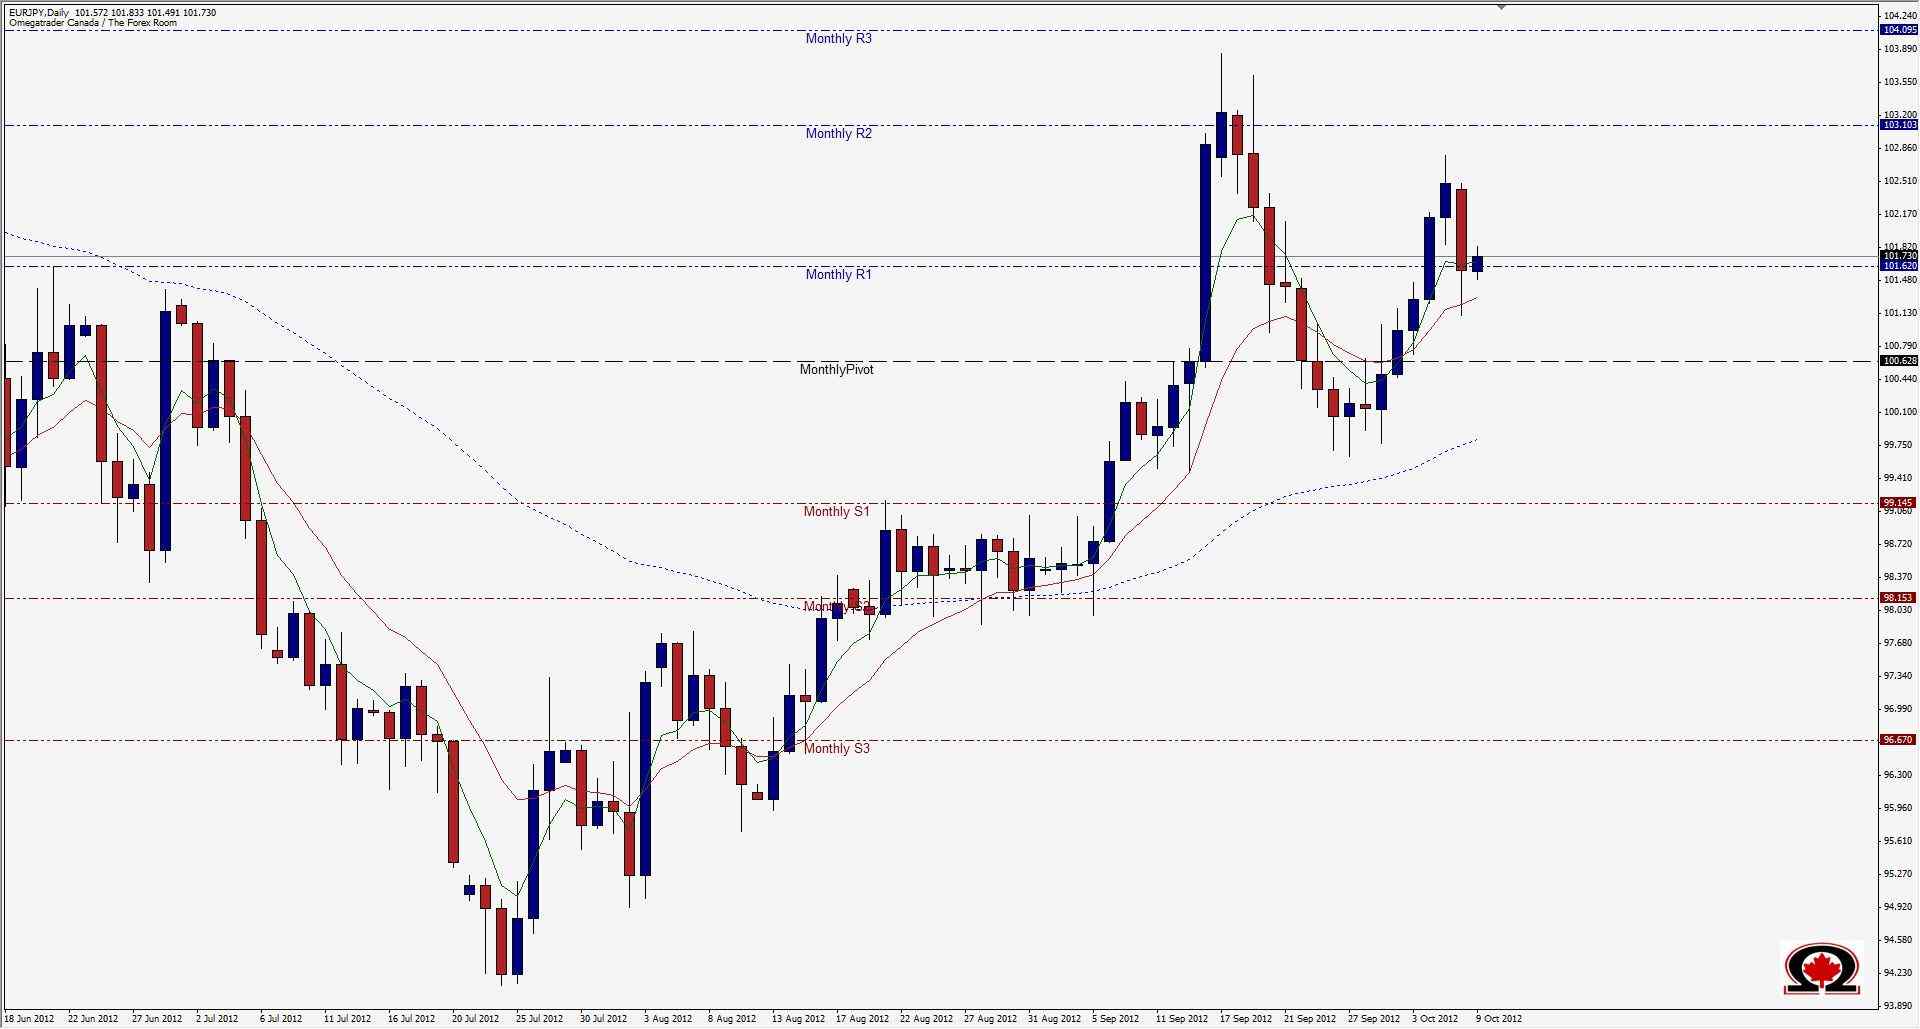
The EUR/JPY daily chart has printed a double top with a lower high than September and a very bearish candle at the end of the day yesterday. The pair bounced off of the 38.2% retrace level of the Bullish move that began in July, but now appears to be rejecting the 103.00 area once again. Last week's weekly candle closed as a Bullish Engulfing candle, possibly hinting that there were higher prices in store this week, but it appears there may be more of a retracement in the cards. If this is the case, there is a high probability that the pair will look for some love from the bears down to the 99.00 area, which is the 50% Fibo level for the same bullish run mentioned above. Support to hinder the bears progress will be in the area's of 101.50, 100.62 & 100.13 along with some minor zones along the way down. However, if the retracement is complete and price begins moving higher, look for Resistance at 102.35, 103.10 and 103.72. If price rockets above 104, I will be watching for this pair to run all the way up to 107 before the end of the year. Bias will be bullish above 100.50, but will look for more bearish action once we break lower than this level.
Happy Trading!

